


FXOpen
Technical Bias: Bullish
Key Takeaways
- Euro broke a crucial resistance versus the US dollar this past week and looks set for more gains.
- EURUSD has a major support at 1.1100, which can be considered as a buy zone.
- Euro Area Manufacturing Purchasing Managers Index (PMI) will be released by the Markit Economics today, which is expected to remain at 51.9.
Recent surge in EURUSD suggests that the pair is under bullish pressure and might continue to trade higher in the near term.
Technical Analysis
The EURUSD pair enjoyed a good bull run this past week, as the US dollar weakened a lot against most major currencies. There was a monster bearish trend line on the daily chart of the EURUSD pair, which acted as a major catalyst in the short term. It managed to settle above the 100-day simple moving average (SMA), which is a solid sign that the Euro bulls are here to stay. If the pair corrects lower from the current levels, then the broken trend line could provide support to the pair. Moreover, the 23.6% fib retracement level of the last leg from the 1.0522 low to 1.1287 high is also sitting around the same area along with the 100-day SMA.
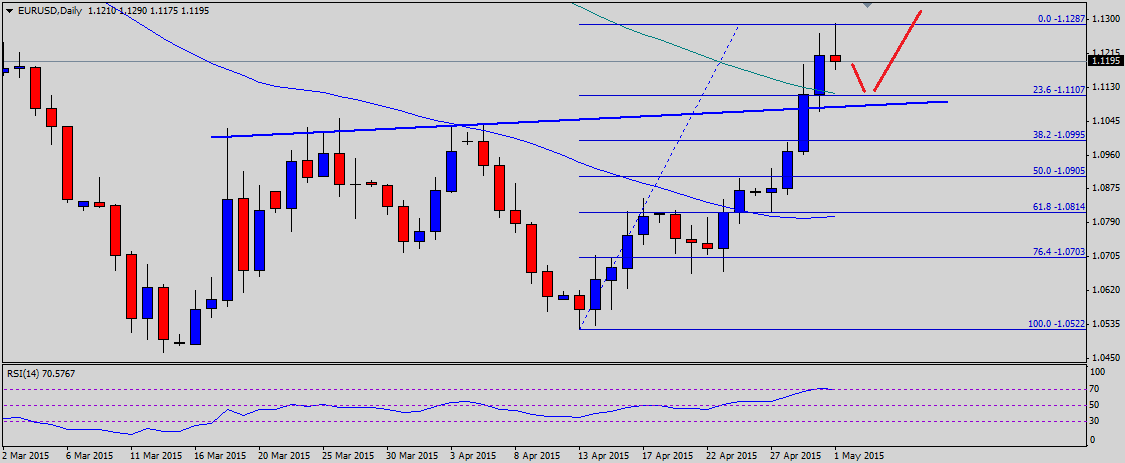
On the upside, a break above the recent high of 1.1287 might clear the way for more gains moving ahead.
The daily RSI is around the overbought level, suggesting a minor correction is possible.
Euro Area Markit PMI
Later during the London session, the Euro Area Manufacturing Purchasing Managers Index (PMI) highlighting business conditions in the manufacturing sector will be released by the Markit Economics. The forecast is of no change in April 2015.
Trade Idea
Buying dips in the EURUSD pair around the 100-day SMA looks good as long as it stays above the same.
Trade over 50 forex markets 24 hours a day with FXOpen. Take advantage of low commissions, deep liquidity, and spreads from 0.0 pips. Open your FXOpen account now or learn more about trading forex with FXOpen.
This article represents the opinion of the Companies operating under the FXOpen brand only. It is not to be construed as an offer, solicitation, or recommendation with respect to products and services provided by the Companies operating under the FXOpen brand, nor is it to be considered financial advice.
Stay ahead of the market!
Subscribe now to our mailing list and receive the latest market news and insights delivered directly to your inbox.

Latest from Forex Analysis
Latest articles

Weekly Market Wrap With Gary Thomson: Nasdaq, EUR/USD, USD/CHF, Brent Crude Oil, Googl Shares
Get the latest scoop on the week's hottest headlines, all in one convenient video. Join Gary Thomson, the COO of FXOpen UK, as he breaks down the most significant news reports and shares his expert insights.
- Nasdaq Composite: Worst Session

Analysis of AUD/USD: Exchange Rate Falls to Early May Low
As indicated by the 4-hour AUD/USD chart today:
→ the rate fell below 0.652, a level last seen on May 2;
→ the RSI indicator dropped below 15, a level last seen during the panic over the spread of COVID-19

Analysis of AMZN Stock: Price at 1.5-Month Low
As shown in the AMZN chart, the stock price dropped below:
→ the psychological level of $180;
→ the mid-June interim low.
The last time AMZN traded below $180 was in early June.
Thus, AMZN has faced sell-offs, similar to other tech