


EUR/USD Nosedives, USD/JPY Remains in Uptrend
FXOpen
EUR/USD declined sharply and broke a key support at 1.1700. On the other hand, USD/JPY accelerated gains and is currently placed nicely above 112.60.
Important Takeaways for EUR/USD and USD/JPY
- The Euro failed to move above the 1.1745 resistance and declined sharply.
- There was a break below a key bullish trend line with support at 1.1730 on the hourly chart of EUR/USD.
- USD/JPY remains in an uptrend above the 112.60 support level.
- There is a crucial bullish trend line in place with support at 112.65 on the hourly chart.
EUR/USD Technical Analysis
The Euro recovered nicely this past week and moved above the 1.1700 resistance against the US Dollar. However, the EUR/USD pair failed to move above the 1.1740-45 resistance area and declined once again.
The pair started a major downward move and broke the 1.1720 support area. More importantly, there was a break below a key bullish trend line with support at 1.1730 on the hourly chart.
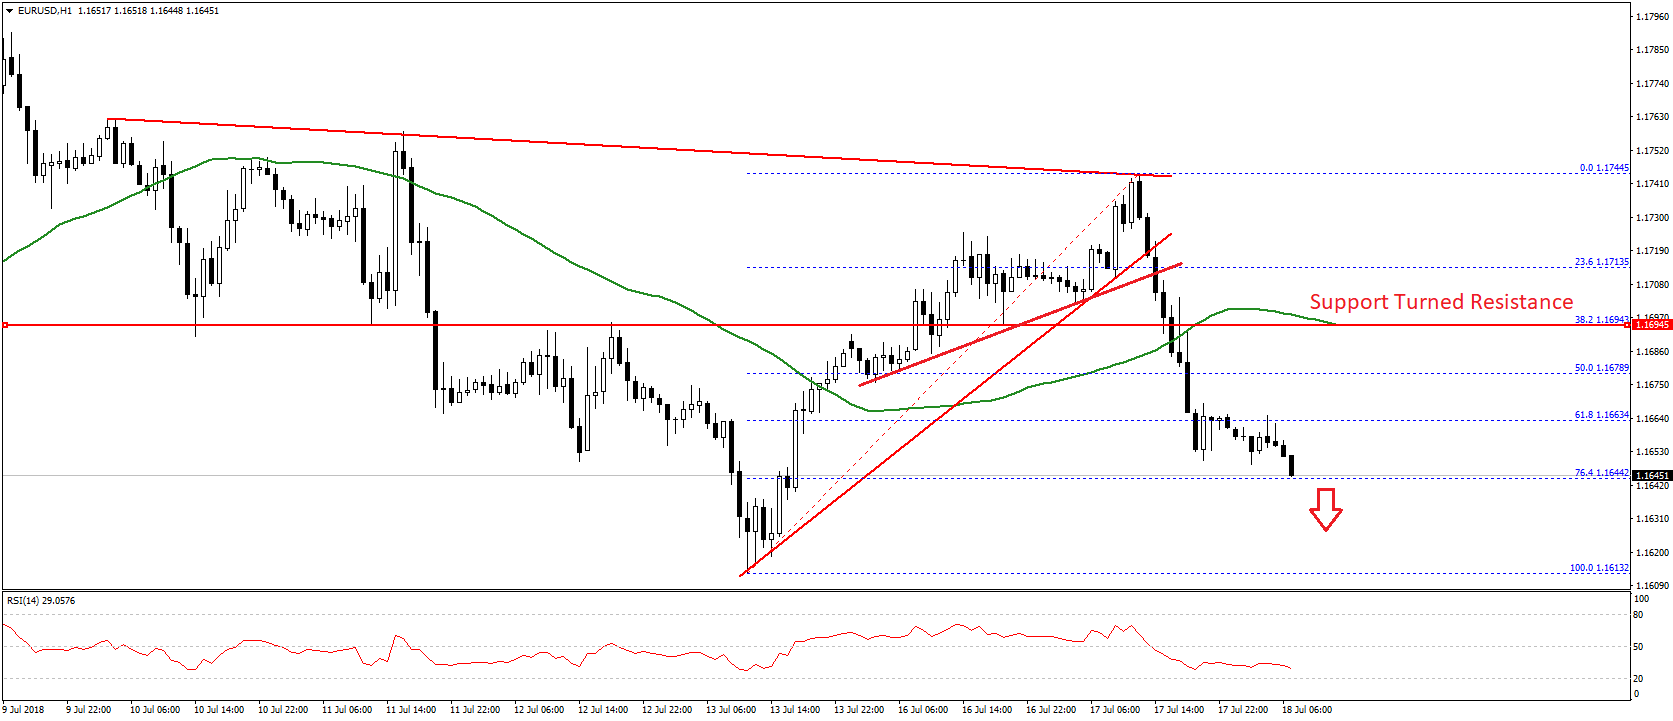
Later, there was a break below the 50% Fib retracement level of the last wave from the 1.1613 low to 1.1744 high. The pair is now placed well below the 1.1700 level and the 50 hourly simple moving average.
It is currently testing the 76.4% Fib retracement level of the last wave from the 1.1613 low to 1.1744 high near 1.1644. Should there be a downside break below 1.1640, the pair is likely to decline further towards the last swing low of 1.1615.
On the flip side, if there is an upward correction, the pair might face resistance near 1.1680. Above this, the previous support at 1.1700 is likely to act as a resistance.
Overall, the recent downside break in EUR/USD has opened the doors for more losses below 1.1640. If the current trend remains intact, there is even a risk of more declines below the 1.1600 level.
Today, the Euro Zone CPI report for June 2018 is scheduled for the release. The market forecast is +0.1% (MoM), less than the last +0.5%. If the actual result misses the forecast, there could an increase in selling pressure on EUR/USD. If the CPI registers more than 0.2% rise, there could be a recovery towards the 1.1700 resistance.
USD/JPY Technical Analysis
The US Dollar surged during the past few days above 112.00 resistance the Japanese Yen. The USD/JPY pair climbed above the 112.60 pivot level and traded above the 113.00 resistance.
A new weekly high was formed at 113.08 before the pair corrected lower. It recently tested the 23.6% Fib retracement level of the last wave from the 112.23 low to 113.08 high. It seems like the pair remains well supported above the 112.60 level and the 50 hourly simple moving average.
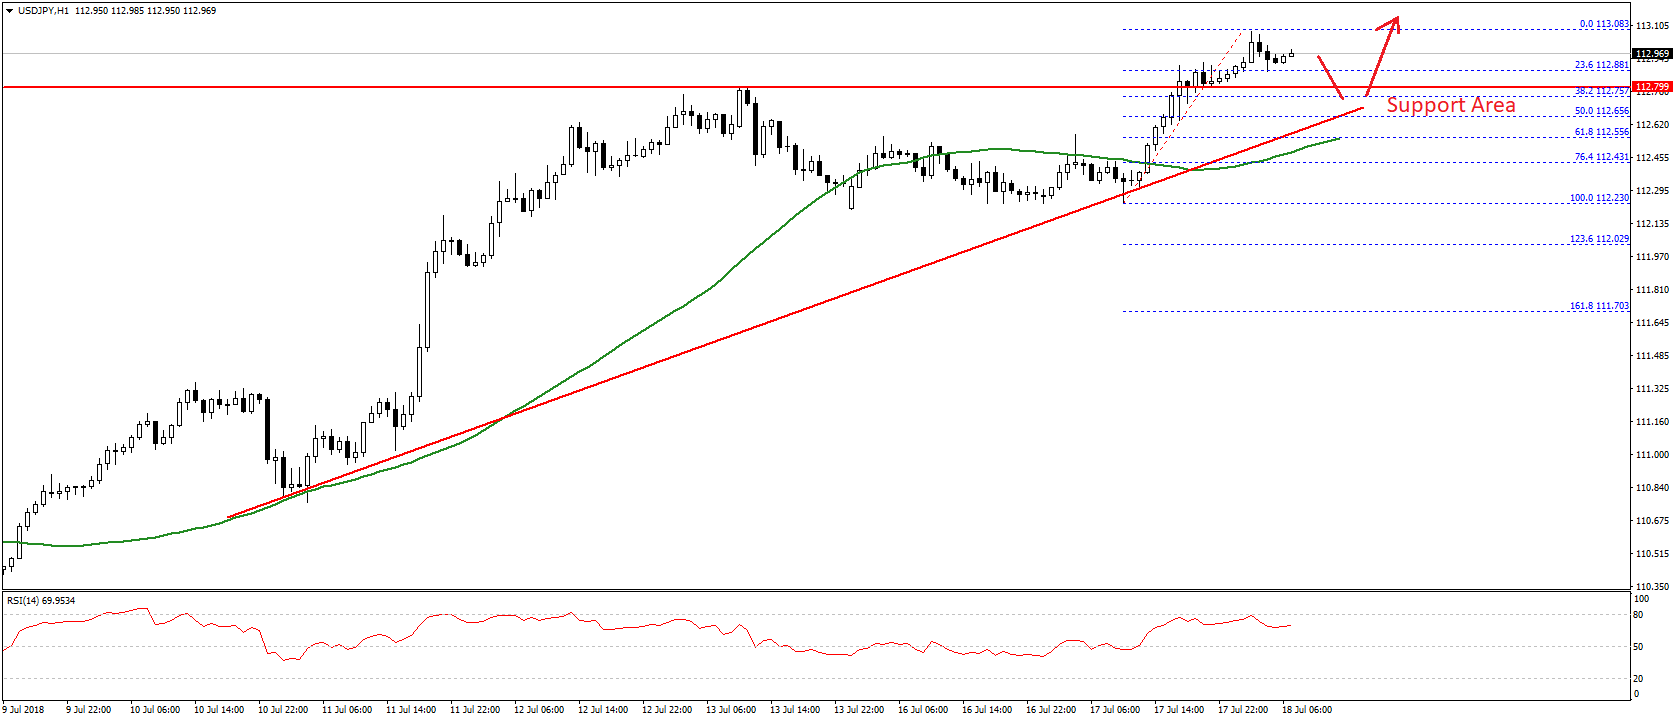
On the downside, there is also a crucial bullish trend line in place with support at 112.65 on the hourly chart. The trend line support is aligned with the 50% Fib retracement level of the last wave from the 112.23 low to 113.08 high.
Therefore, if the pair corrects lower towards 112.60-70, it is likely to find support. Below this, the pair may well drop back towards the 112.00 support.
On the upside, a push above the 113.08 high may open the doors for a surge towards the next crucial hurdle at 114.00 in the near term.
Trade over 50 forex markets 24 hours a day with FXOpen. Take advantage of low commissions, deep liquidity, and spreads from 0.0 pips (additional fees may apply). Open your FXOpen account now or learn more about trading forex with FXOpen.
This article represents the opinion of the Companies operating under the FXOpen brand only. It is not to be construed as an offer, solicitation, or recommendation with respect to products and services provided by the Companies operating under the FXOpen brand, nor is it to be considered financial advice.
Stay ahead of the market!
Subscribe now to our mailing list and receive the latest market news and insights delivered directly to your inbox.


Latest articles

Amazon Earnings: Does the Chart Already Know Something the Numbers Don't?
All eyes are on July 30, when Amazon reports Q2 2026 earnings, with Wall Street increasingly convinced the bar has been set too low. Consensus sees EPS near $1.82-$2.26 on roughly $197 billion in revenue, but the

WTI Analysis: Gap Breaks Short-Term Trend as Price Remains Trapped Between the POC and Profile Boundary
WTI crude oil plunged by more than 7% on 27 July 2026 after the US suspended a series of strikes against Iran over the weekend, raising hopes of a diplomatic solution and the reopening of shipping through the Strait of

US Dollar Index: A Defining Week for the King of the Markets
The dollar heads into a pivotal week trading near 101.80, just off a 15-month high, with the Fed's July 29 meeting standing as the clear focal point. Markets currently price roughly a 65% chance of a hold, though renewed