


EUR/USD Under Pressure While USD/CHF Remains Supported
FXOpen
EUR/USD broke a key support at 1.1750 and moved down. USD/CHF is placed nicely in a bullish zone above the 0.9900 support area.
Important Takeaways for EUR/USD and USD/CHF
- The Euro formed a short-term top near 1.1790 and declined against the US Dollar.
- The EUR/USD pair broke a major bullish trend line with support at 1.1752 on the hourly chart.
- USD/JPY is placed nicely above the 0.9900 support area.
- Upsides face resistances near the 0.9940 and 0.9960 levels.
EUR/USD Technical Analysis
The Euro was in a major uptrend from the 1.1620 swing low against the US Dollar. The EUR/USD pair surged above the 1.1650, 1.1700 and 1.1750 resistance levels.
The upside move was strong since the pair traded close to the 1.1800 resistance. A high was formed at 1.1790 and the pair started a downside correction. During the decline, the Euro broke a key support area at 1.1750.
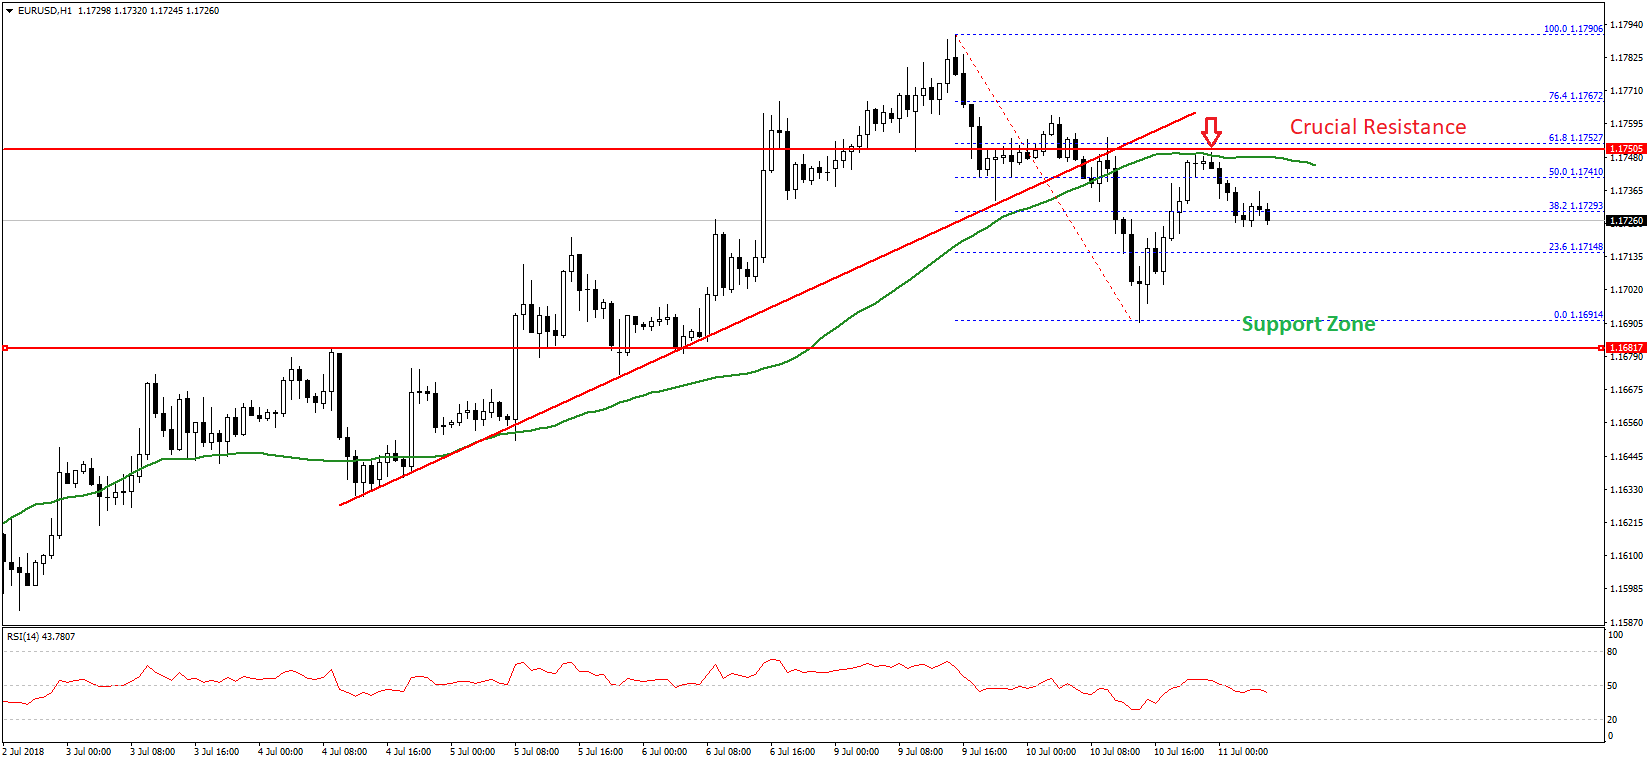
More importantly, there was a break below a major bullish trend line with support at 1.1752 on the hourly chart. The pair settled below the 1.1750 support and the 50 hourly simple moving average.
It traded as low as 1.1691 and corrected above the 50% Fib retracement level of the last decline from the 1.1790 high to 1.1691 low. However, the broken support at 1.1750 and the 50 hourly SMA acted as resistance and prevented gains.
Additionally, the 61.8% Fib retracement level of the last decline from the 1.1790 high to 1.1691 low also acted as a resistance. The pair is moving lower once again and is currently trading near 1.1725.
On the downside, the 1.1680-1.1700 zone is a decent support area. Below this, the pair may perhaps revisit the 1.1650 support area. On the upside, the 1.1750 resistance holds a lot of importance.
Only a successful close above the mentioned resistance and 50 hourly SMA could put the pair back in an uptrend. If not, the pair is likely to retest the 1.1690 low and it may well trade towards 1.1650.
USD/CHF Technical Analysis
The US Dollar moved higher sharply from the 0.9858 low against the Swiss franc. The USD/CHF pair traded above the 0.9880 and 0.9900 resistance levels to move into a bullish zone.
It even traded above the 0.9950 resistance, but it failed to overcome sellers near 0.9960. A high was formed at 0.9961 and the pair corrected below the 23.6% Fib retracement level of the last wave from the 0.9858 low to 0.9961 high.
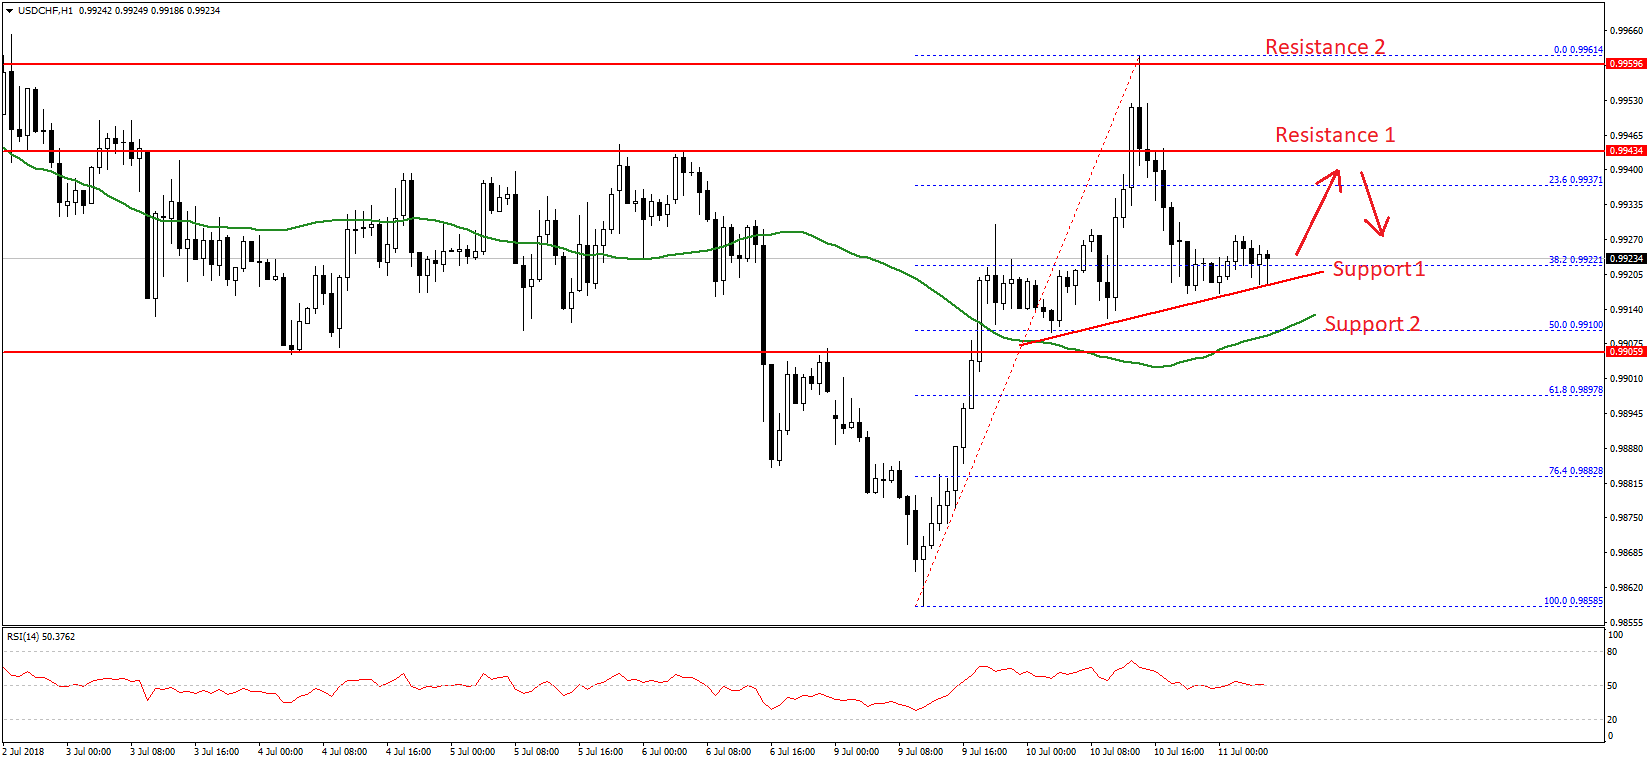
However, losses were contained by a connecting bullish trend line with current support at 0.9920 on the hourly chart. Below the trend line support, the next support is around 0.9910 and the 50 hourly simple moving average.
Moreover, the 50% Fib retracement level of the last wave from the 0.9858 low to 0.9961 high is also near 0.9910. Therefore, if the pair breaks the trend line support, it is likely to find a strong buying interest near the 0.9910 level.
On the upside, an initial resistance is near the 0.9940 level, above which, the pair may well retest the 0.9960 resistance.
Overall, the current bias is positive and as long as USD/CHF is above 0.9900-0.9910, it remains supported for more gains in the near term.
Trade over 50 forex markets 24 hours a day with FXOpen. Take advantage of low commissions, deep liquidity, and spreads from 0.0 pips (additional fees may apply). Open your FXOpen account now or learn more about trading forex with FXOpen.
This article represents the opinion of the Companies operating under the FXOpen brand only. It is not to be construed as an offer, solicitation, or recommendation with respect to products and services provided by the Companies operating under the FXOpen brand, nor is it to be considered financial advice.
Stay ahead of the market!
Subscribe now to our mailing list and receive the latest market news and insights delivered directly to your inbox.


Latest articles

Weekly Market Insights with Gary Thomson: The Week of Central Banks and Earnings
In this video, we’ll explore the key economic events and market trends, shaping the financial landscape. Get ready for insights into financial markets to help you navigate the week ahead. Let’s dive in!
In this episode of Market

Intel at a Crossroads: Earnings Beat Meets Technical Resistance
Intel has just delivered its strongest quarter in over fifteen years, and the market reaction says it all. Q2 2026 revenue surged 25% year-over-year to $16.1 billion, crushing the consensus estimate of $14.42 billion, while adjusted EPS of

Tesla: Complex Range Structure Breaks Down Following Quarterly Earnings
Tesla released its Q2 2026 results after the market closed on 22 July. Revenue increased 26% year-on-year to $28.24 billion, while vehicle deliveries reached a record 480,126 units. However, operating margin fell sharply to 1.4%, down from