Explaining the ZigZag Pattern with the Elliott Theory
A zigzag is a corrective wave. As Ralph Elliott put it back in the 1930s, this is the trickiest corrective wave of them all. How come?
The answer is quite simple: it has not one, but two impulsive waves of a lower degree. Hence, traders confuse the pattern with an impulsive wave of a larger degree, when in fact the market simply corrects.
Just like flats, a zigzag is a three-wave structure. For the Elliott Wave trader, it should come at no surprise that the labeling for the pattern is a-b-c.
As a reminder, the Elliott theory uses numbers to label impulsive waves and letters for corrective ones. Hence, the a-b-c shows corrective activity.
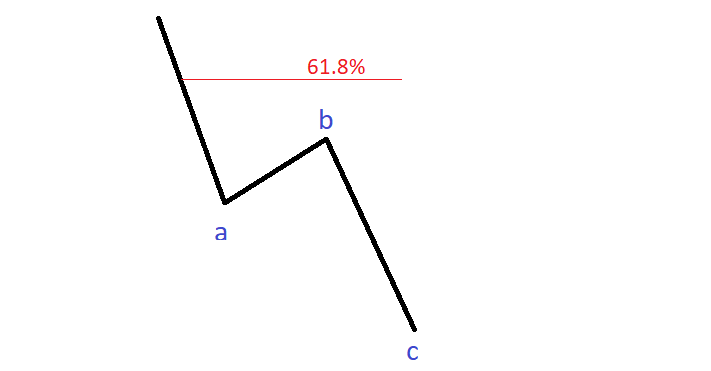
When compared with a flat pattern, the zigzag has many particularities. First, both waves a and c are impulsive. Second, the b-wave must NOT retrace more than 61.8% of the previous a-wave.
That being said, the types of the zigzags are given by the c-wave’s length.
Minimum Requirements for the ZigZag Pattern
A zigzag has specific rules. It should come as no surprise as Ralph Elliott was an accountant. Hence, the affinity for rules and patterns should not take anyone by surprise.
If the flat pattern required the b-wave to retrace more than 61.8% of the previous a-wave, the zigzag differs. The b-wave must NOT retrace more than the golden ratio.
Moreover, most of the times the b-wave retraces 23.6% or 38/2% of the previous a-wave. Many traders consider the moves that retrace more than the 38.2% level as suspicious activity and start discounting the possibility that the market forms a zigzag.
To make it simple, Ralph Elliott established some strict rules for a zigzag. The b-wave’s minimum retracement is 1%, while it must not close beyond the 61.8%.
Different Types of ZigZag Patterns
While flats are more numerous, the Elliott Waves Theory established only three types of zigzags. The common point with the flat pattern is that the zigzag’s type depends on the c-wave’s length.
Hence, there are some steps the Elliott trader must follow. Here they are:
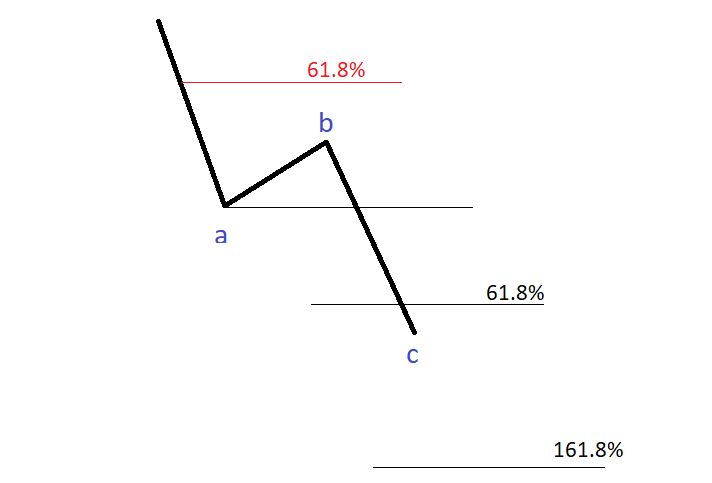
- take a Fibonacci retracement tool and measure the a-wave’s length (tip: measure it from the start to its end, not from the highest to lowest/lowest to highest point)
- make sure the a-wave respects the rules of an impulsive wave, as established by Elliott
- also make sure that the b-wave doesn’t retrace more than 61.8% of the a-wave – if it retraces more than 50%, start discounting the possibility that the market forms a zigzag
- when the c-wave’s length is less than 61.8% of the a-wave, the market forms a truncated zigzag (tip: it is typically retraced minimum 80%)
- if the c-wave’s length is between 61.8% and 161.8% of the a-wave, the market forms a normal zigzag (tip: almost ninety percent of all zigzags are normal ones)
- when the c-wave’s length exceeds 161.8% of the a-wave, the market forms an elongated zigzag
One more thing to consider: the zigzag is one of the few patterns part of the Elliott Waves Theory (and technical analysis in general) that considers the time element. Therefore, one thing that few traders know is that, in a zigzag, the time it took wave a to form must equal the time it took wave c.
Because the currency market is volatile, there may be some discrepancies. Nevertheless, the time for the two waves must be similar, otherwise, the Elliott rules discount the pattern as a zigzag.
Conclusion
The zigzag is a deceiving pattern. Because it has two impulsive waves (wave a and wave c), most traders look for the extended wave part of a larger degree impulsive wave.
In fact, the market corrects aggressively, and the pullback is just an opportunity to trade in the direction of the underlying trend. Therefore, understanding zigzags is crucial for every trader willing to swing trade following the Elliott Waves rules.