


FXOpen
Fair value gaps (FVGs) and liquidity voids highlight moments when price moves aggressively due to order imbalances. While they are closely related within the Smart Money Concept (SMC) framework, they differ in scale, structure, and trading application. This article explains how each forms, how they interact, and how traders may incorporate them into a structured market analysis approach.
Takeaways
- A fair value gap (FVG) is a pattern that reflects a short-term price imbalance visible in a three-candle structure, where the middle candle displaces so aggressively that the wicks of candles one and three fail to overlap, leaving an inefficient zone.
- A liquidity void is a broad displacement zone spanning multiple candles, often containing several FVGs stacked together. These typically form during major news events, institutional order flow, or off-hours repricing, when there is a disbalance between buyers and sellers.
- FVG and liquidity void concepts reflect aggressive repricing driven by one-sided order flow, where buying or selling pressure overwhelms the opposing side. The market tends to revisit these zones later to establish more balanced two-sided trading.
- Context matters more than the pattern itself. An FVG or liquidity void gains significance when aligned with higher-timeframe structure, order blocks, or key support and resistance levels. Isolated gaps without confluence tend to be less actionable.
- Neither FVGs nor liquidity voids guarantee a fill. While the market often retraces into these zones, some remain open indefinitely, particularly liquidity voids tied to fundamental shifts that permanently reprice an asset.
Fair Value Gap (FVG) Meaning in Trading
A fair value gap (FVG) is a price imbalance that forms when the market moves sharply in one direction. It shows that buying or selling pressure was temporarily much stronger, causing prices to move too quickly for balanced trading.
An FVG forms within a three-candle sequence:
- The first candle establishes the initial range.
- The second candle (often a large displacement candle) moves strongly in one direction.
- The third candle’s low should be above the first candle’s high.
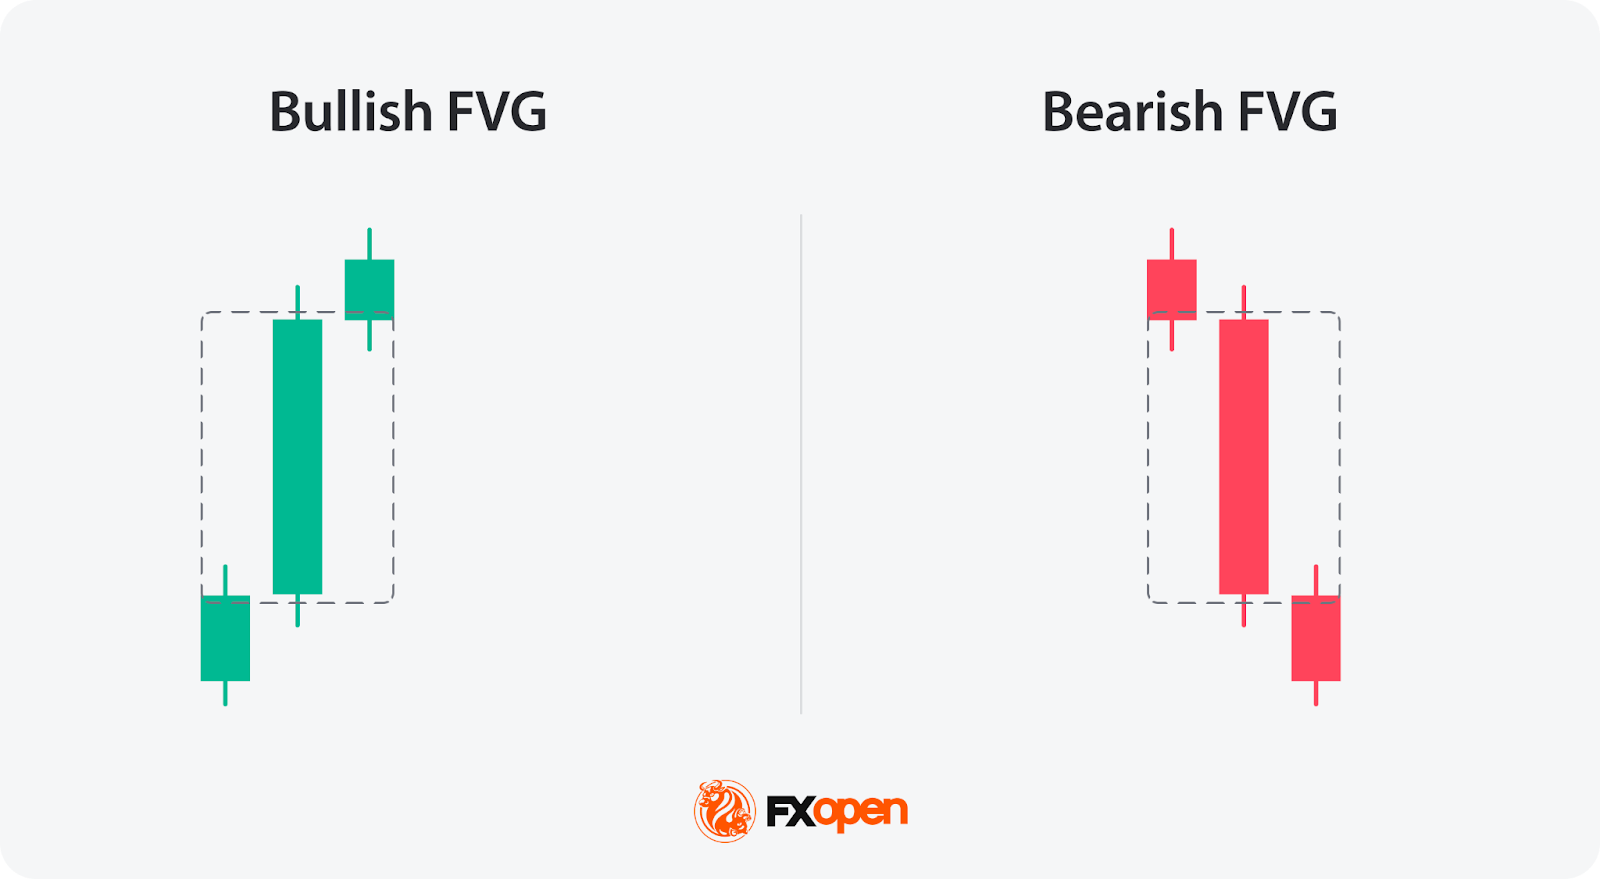
FVGs are categorised as either bullish or bearish depending on the direction of the displacement move.
A bullish FVG is a strong upward move. The gap sits between the high of the first candle and the low of the third candle, with the second candle driving the price sharply higher. This zone is considered a potential area of demand, and traders often watch for price to retrace down into it before continuing upward.
A bearish FVG is a strong downward move. Here, the gap sits between the low of the first candle and the high of the third candle, with the second candle driving the price sharply lower. This zone is viewed as a potential area of supply, where traders may look for price to retrace upward into it before continuing to the downside.
In both cases, the gap represents a zone where one-sided pressure dominated and two-sided trading did not occur. The wider the gap, the more aggressive the imbalance.
The gap between the first and third candle’s wicks - the imbalance - is considered a price inefficiency because price moved too quickly for two-sided trading to occur.
Why Do Imbalances Form?
Imbalances occur when one side of the market overwhelms the other. This can result from sudden shifts in sentiment, large institutional orders, news releases, or liquidity sweeps. The lack of opposing orders at certain price levels causes prices to move rapidly, skipping over zones where balanced trading would normally take place.
What Timeframe Is the Most Popular for FVG Trading?
FVGs appear on all timeframes, but the 15-minute, 1-hour, and 4-hour charts are among the more commonly used. Lower timeframes produce more frequent but less significant gaps, while higher timeframes tend to reflect stronger institutional activity and more meaningful imbalances.
How Are FVGs Traded?
Fair value gaps are typically traded as areas where price may return to rebalance an earlier imbalance and continue moving in the initial direction after. When price retraces into an FVG, it revisits the zone where one-sided pressure previously dominated, allowing more balanced trading to occur.
- Step 1 - Confirming the trend direction: Traders typically start by assessing the broader market structure, using higher-timeframe analysis. A bullish FVG carries more weight in an uptrend, and a bearish FVG is often more relevant in a downtrend.
- Step 2 - Waiting for price to retrace into the gap: Rather than entering at the moment the FVG forms, traders commonly wait for price to pull back into the gap zone before looking for a reaction.
- Step 3 - Looking for confluence: FVGs that overlap with order blocks, breaks of structure, or support and resistance levels are generally considered higher-probability zones than isolated gaps.
- Step 4 - Managing the position: Some traders use partial fills. Price does not always fully close the gap; reacting from the midpoint of the FVG is common. Stops are often placed beyond the gap boundary, while targets may align with previous highs/lows or opposing liquidity.
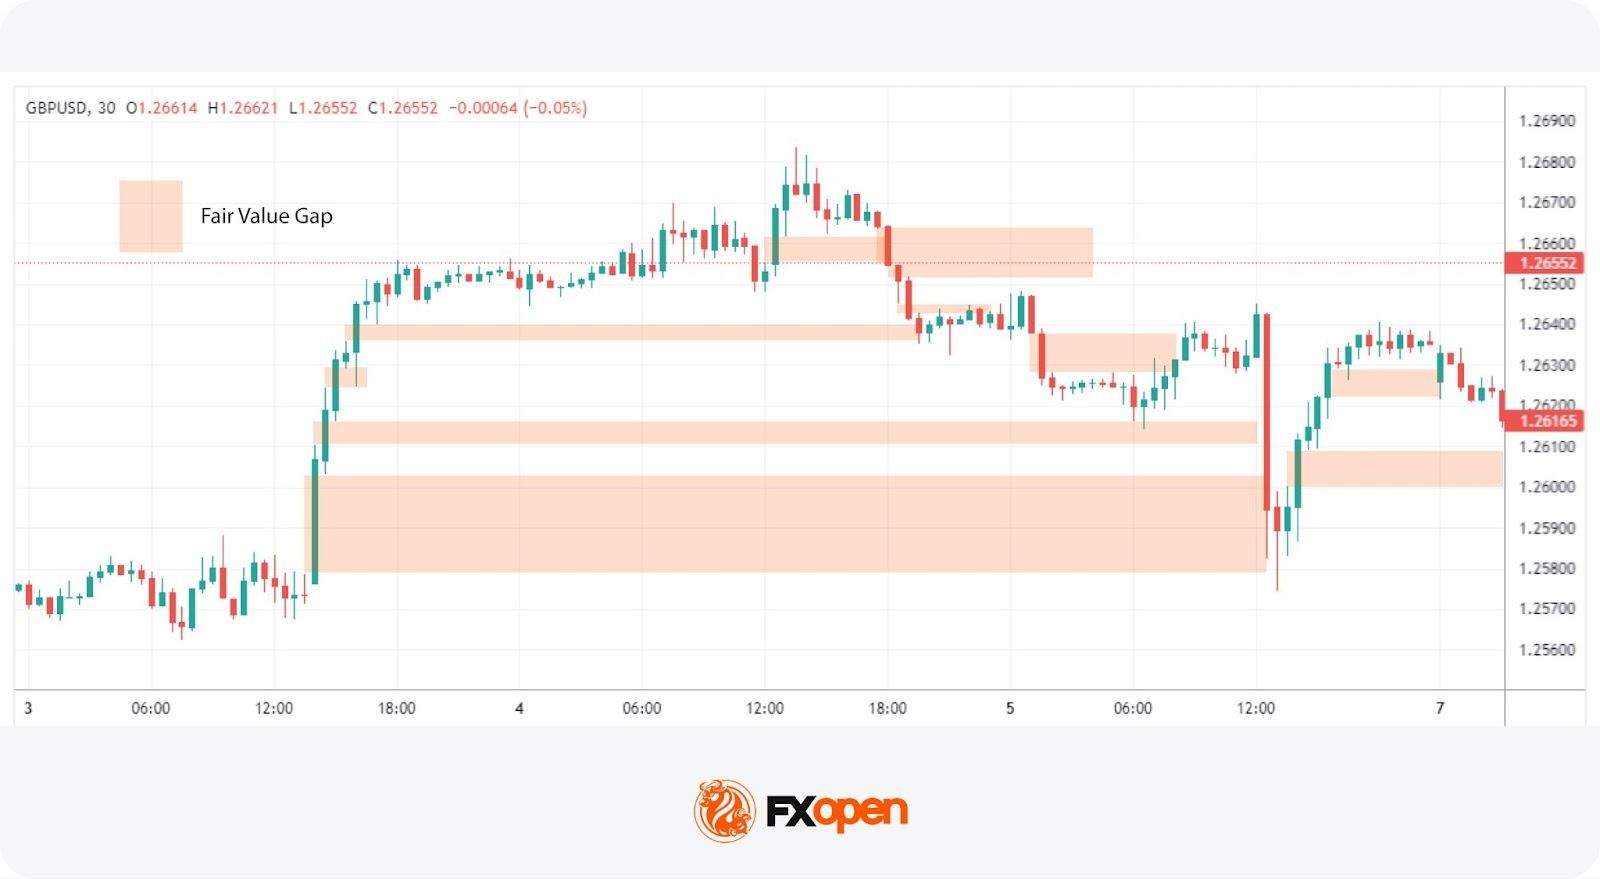
On the 15-minute GBP/USD chart, the price formed a fair value gap. A trader could open a buy position after price retraces into the gap, placing a stop-loss order below the nearest swing low. The take-profit level could be set at the nearest resistance level, or the stop loss could be trailed to lock in potential profits as price moves higher.
When Do FVGs Get Filled?
FVGs are filled when the market revisits zones of inefficient price delivery, though timing depends on several factors.
- Market rebalancing. After a sharp, one-sided move creates an imbalance, price tends to return to that area to establish more balanced trading where it previously did not occur.
- Liquidity seeking. Market makers often drive prices back into these gaps to fill remaining orders, treating FVGs as zones where liquidity may still be present.
- Trend retracements. In a strong trend, price frequently fills a gap created by an impulsive move before continuing in the original direction. These pullbacks into FVGs are among the more common setups.
- News-driven volatility. Major economic releases often create rapid moves that leave FVGs behind, which are then filled during retracements as volatility contracts.
- Timeframe variation. FVGs appear on all charts, but those on higher timeframes tend to be filled more consistently than gaps on lower timeframes.
You can open the TickTrader trading platform and test fair value gaps on multiple timeframes.
Liquidity Void Meaning in Trading
Liquidity voids represent significant, abrupt price movements between two levels on a chart without the usual gradual trading activity in between. These are essentially larger and more substantial versions of fair value gaps, often encompassing multiple candles and FVGs, indicating a more pronounced imbalance between buy and sell orders.
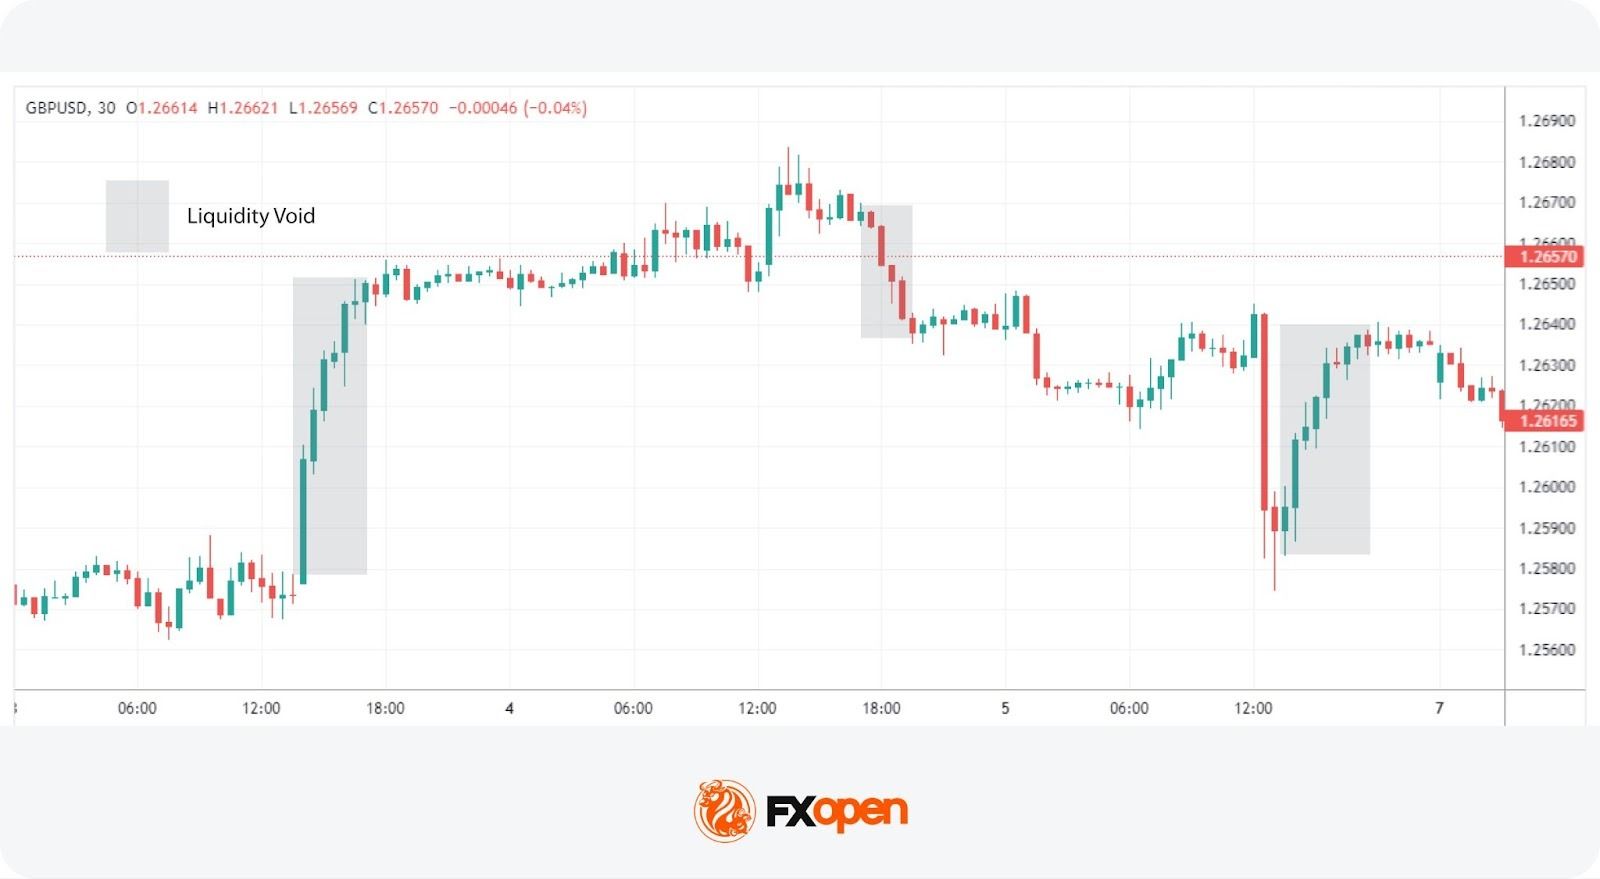
While FVGs occur frequently and reflect the day-to-day shifts in market sentiment, liquidity voids signal a rapid repricing of an asset, typically following significant market events (though not always).
These voids are visual representations of moments when the market experiences a temporary absence of balance between buyers and sellers. This imbalance leads to a sharp move as the market seeks a new equilibrium price level. Such occurrences are not limited to specific times but they’re most obvious following major news events, such as NFP, CPI, or GDP releases, when the market rapidly adjusts to new information. Also, they can happen during off-market hours or following large institutional trades that significantly move the market with a single order.
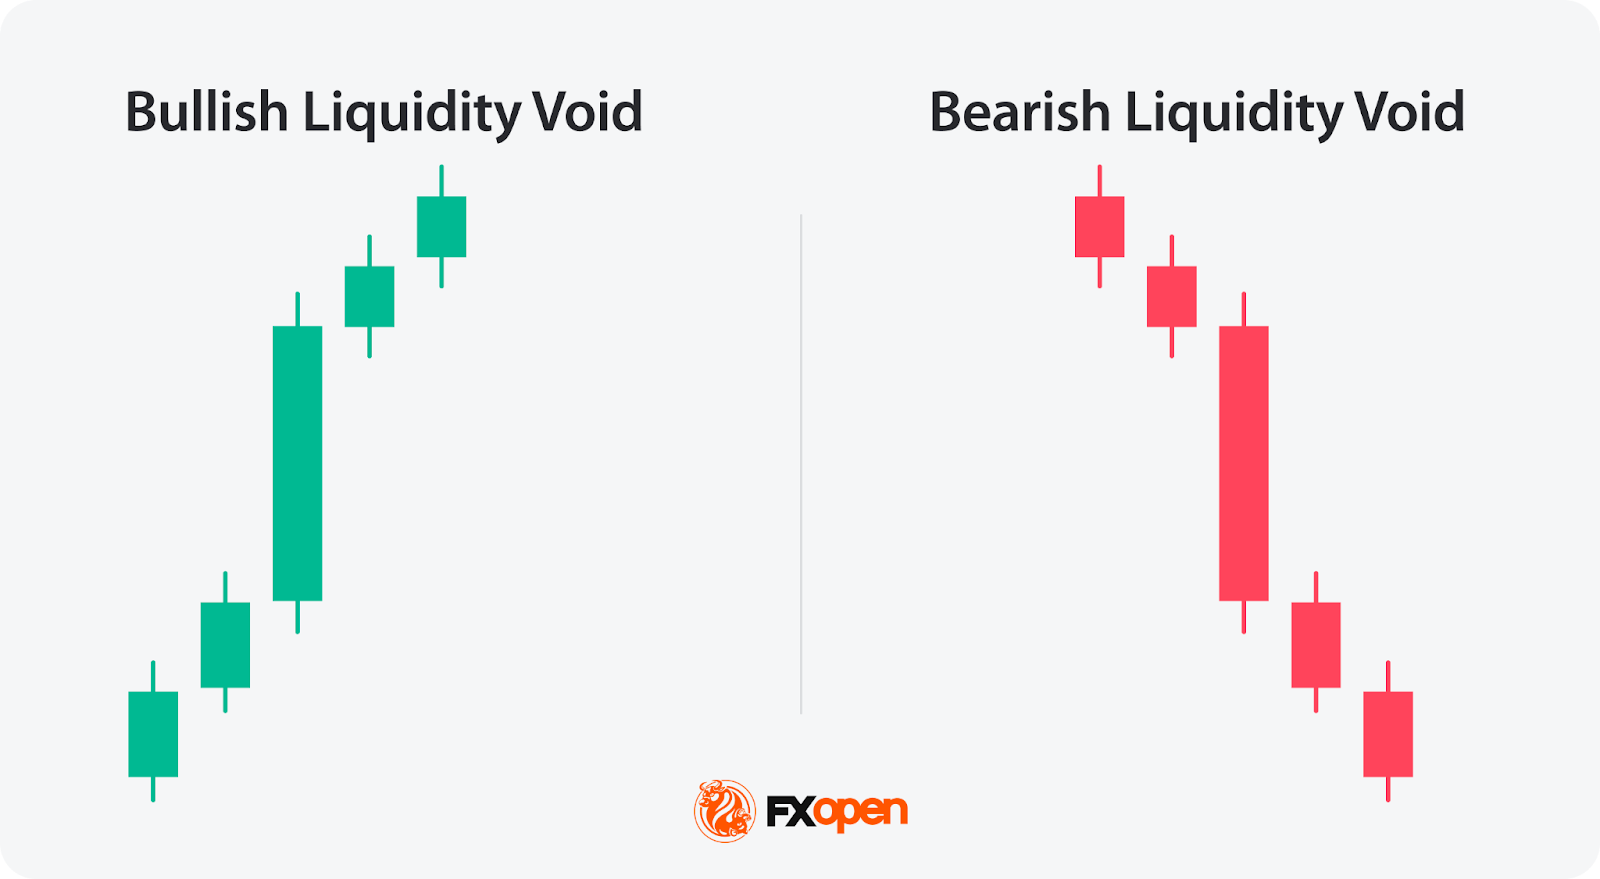
Liquidity voids are categorised as bullish or bearish:
- A bullish liquidity void forms when price displaces sharply upward across multiple candles, leaving a large zone below with minimal trading activity. This area may act as a demand zone if price retraces.
- A bearish liquidity void forms during a sharp downward displacement, creating a wide zone above where little two-sided trading took place. This area may act as a supply zone on any retracement.
The wider and more aggressive the void, the more significant the repricing event it represents, though confirmation from surrounding structure remains important.
What Timeframe Is the Most Popular for Liquidity Void Trading?
Liquidity voids are visible on all timeframes, but the 1-hour, 4-hour, and daily charts are among the more commonly referenced. Because voids represent larger-scale repricing events, higher timeframes tend to capture them more clearly. Lower timeframes may show the individual FVGs within a void but often lack the context to assess the full displacement.
Why Do Liquidity Voids Form?
Liquidity voids form when a sudden surge of volume removes available orders from one side of the market. Causes include:
- Major economic data releases (NFP, CPI, GDP)
- Central bank interest rate decisions
- Geopolitical events or unexpected headlines
- Institutional order flow
- Gaps between trading sessions or during off-hours
Unlike individual FVGs, liquidity voids typically reflect a more significant repricing event.
How Are Liquidity Voids Traded?
Rather than entering positions directly within a void, many traders treat them as transit zones that price is likely to move through quickly on its way to more significant areas of interest.
- Step 1 - Establishing directional bias: The direction of the void typically sets the broader bias. Traders often use this as a filter before looking for setups.
- Step 2 - Waiting for price to reach the void: Rather than acting immediately, traders commonly wait for price to retrace into or near the void before assessing the next move.
- Step 3 - Entering the market:
The first approach: After the impulse move, the market often slows down and partially fills the thinly traded zone. Traders look for confirmation signals — such as lower-timeframe structure shifts, rejection wicks, or declining momentum. Traders aim to trade the fill of the gap.
Another method is to treat liquidity voids as continuation zones. If the broader trend remains intact and the retracement is shallow, traders may position for the next expansion phase once the void begins to fill and price stabilises.
- Step 4 - Setting a take-profit order: If traders trade the retracement, they could target the important levels within the gap. If they trade the trade continuations, they could place price targets past the void at order blocks or key support and resistance levels.
- Step 5 - Setting a stop-loss order: Stop-loss orders might be placed beyond the opposite side of the void.
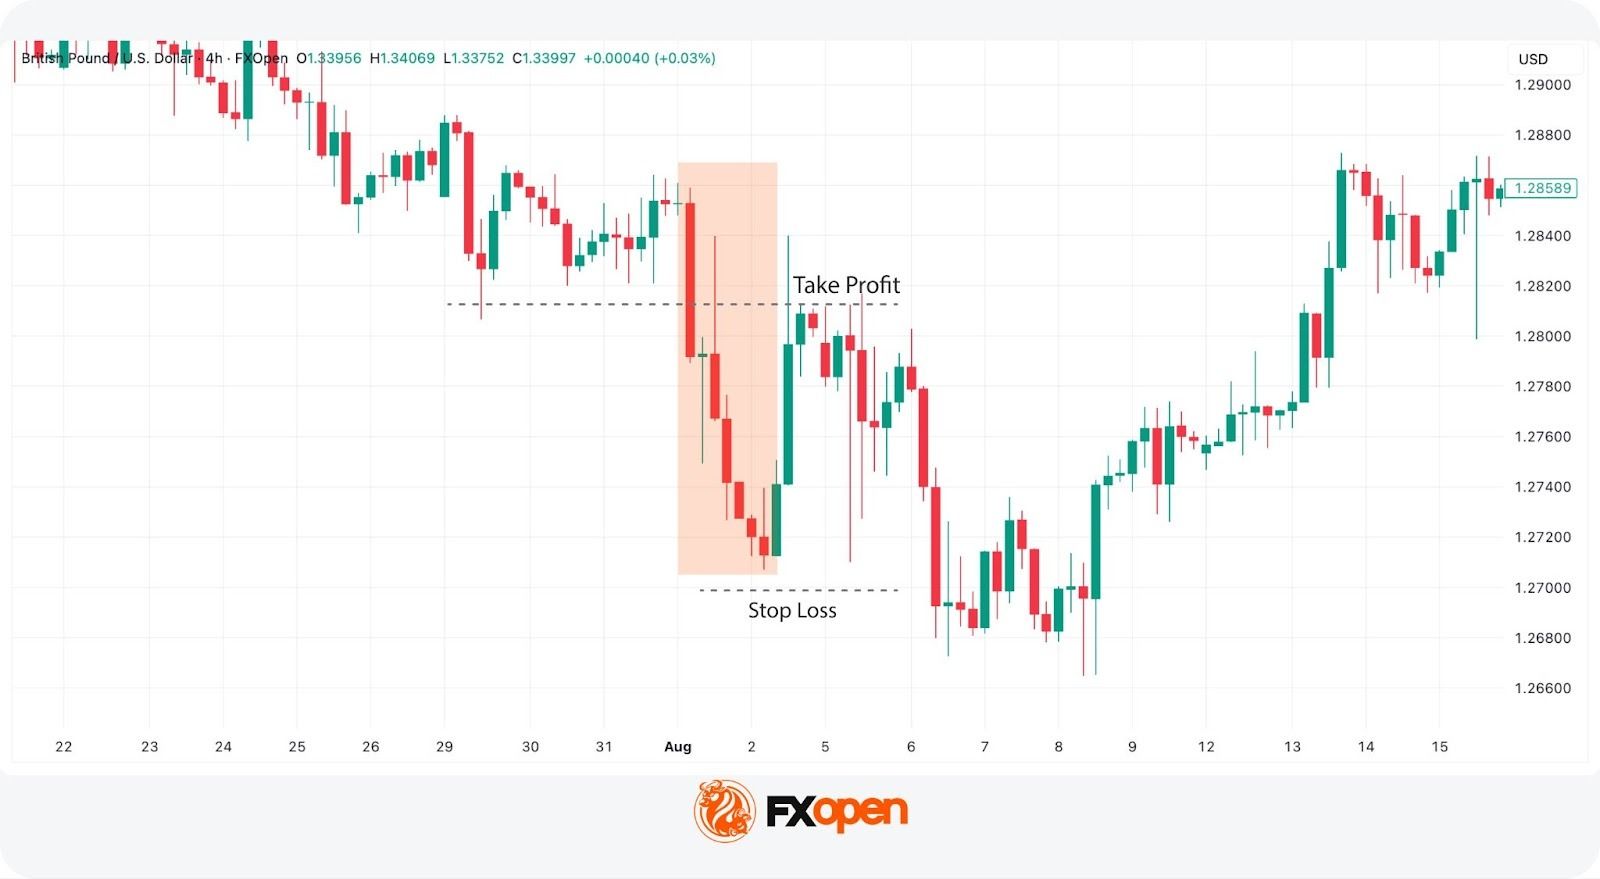
On the 4-hour GBP/USD chart, a bearish liquidity void formed after a strong downward impulse.
In this scenario, traders could focus on trading the fill of the void rather than trend continuation. After the impulsive drop, price retraced upward to partially cover the gap. A trader could consider entering a long position once there are signs that the retracement is gaining momentum inside the void, aiming to capture a deeper fill of the imbalance.
The take-profit level could be set near the previous support level that has turned into resistance, aligning the target with a nearby structural zone. A stop-loss order could be set below the recent swing low formed prior to the retracement.
When Liquidity Voids Get Filled
Liquidity voids tend to attract price back over time, though the speed and extent of the fill varies depending on market conditions.
- Market rebalancing. Voids represent zones of inefficient price delivery. The market often revisits these areas to establish more balanced two-sided trading where it previously did not occur.
- Price magnetism. Unfilled voids can act as magnets, drawing price back towards them. Once filled, these zones frequently trigger a reaction or reversal.
- Volatility stabilisation. After a sharp displacement creates a void, price often drifts back into the area as momentum fades and volatility contracts.
- Timeframe variation. Some voids fill within a few sessions, while others take significantly longer depending on the strength of the original move and ongoing order flow.
- Trend context. In strong trending conditions, counter-trend voids may remain unfilled for extended periods as the market continues in its original direction before any retracement occurs.
Fair Value Gap vs Liquidity Void
Let’s discuss how the fair value gap and liquidity void concepts differ.
Fair value gaps and liquidity voids both represent price imbalances.
A fair value gap is a price imbalance that forms within 3 candles when the market moves sharply in one direction, creating a gap between candles where little to no trading occurs.
A liquidity void refers to a broader displacement move that may contain multiple fair value gaps. It extends over larger portions of the chart, showcasing a significant repricing of an asset.
Fill Speed
FVGs tend to be filled more quickly than liquidity voids. Because they represent smaller, localised imbalances, the market often retraces through them within a few candles or sessions as normal order flow resumes. Liquidity voids can remain open for significantly longer due to the scale of the original displacement, and those driven by fundamental catalysts may remain unfilled indefinitely.
Cause
FVGs typically result from local order imbalances within regular market activity, where a cluster of buy or sell orders at a particular level causes a short-term displacement without requiring an external catalyst. Liquidity voids are more commonly associated with macroeconomic data releases, central bank decisions, or liquidity sweeps where price runs through a cluster of stop orders before displacing aggressively. The cause behind a void tends to reflect a meaningful shift in how the market values an asset rather than a temporary imbalance.
Both FVGs and liquidity voids highlight a critical market phenomenon: when a notable supply and demand imbalance occurs, it tends to create a vacuum that the market is likely to fill at some future point. Therefore, it’s important to recognise that both these types of imbalances can act as potential indicators of future price movement back towards these unfilled spaces.
If you want to explore the differences between FVGs and liquidity voids directly on live market charts, consider FXOpen’s TickTrader platform, providing over 1,200 market analysis tools.
Fair Value Gaps and Liquidity Voids Strategy: Live Example
FVGs and liquidity voids alone may not form a complete imbalance trading strategy. However, when combined with other Smart Money Concept tools such as order blocks and breaks of structure, they can contribute to a more structured framework for market analysis.
The following example uses GBP/USD on the 4-hour and 15-minute charts.
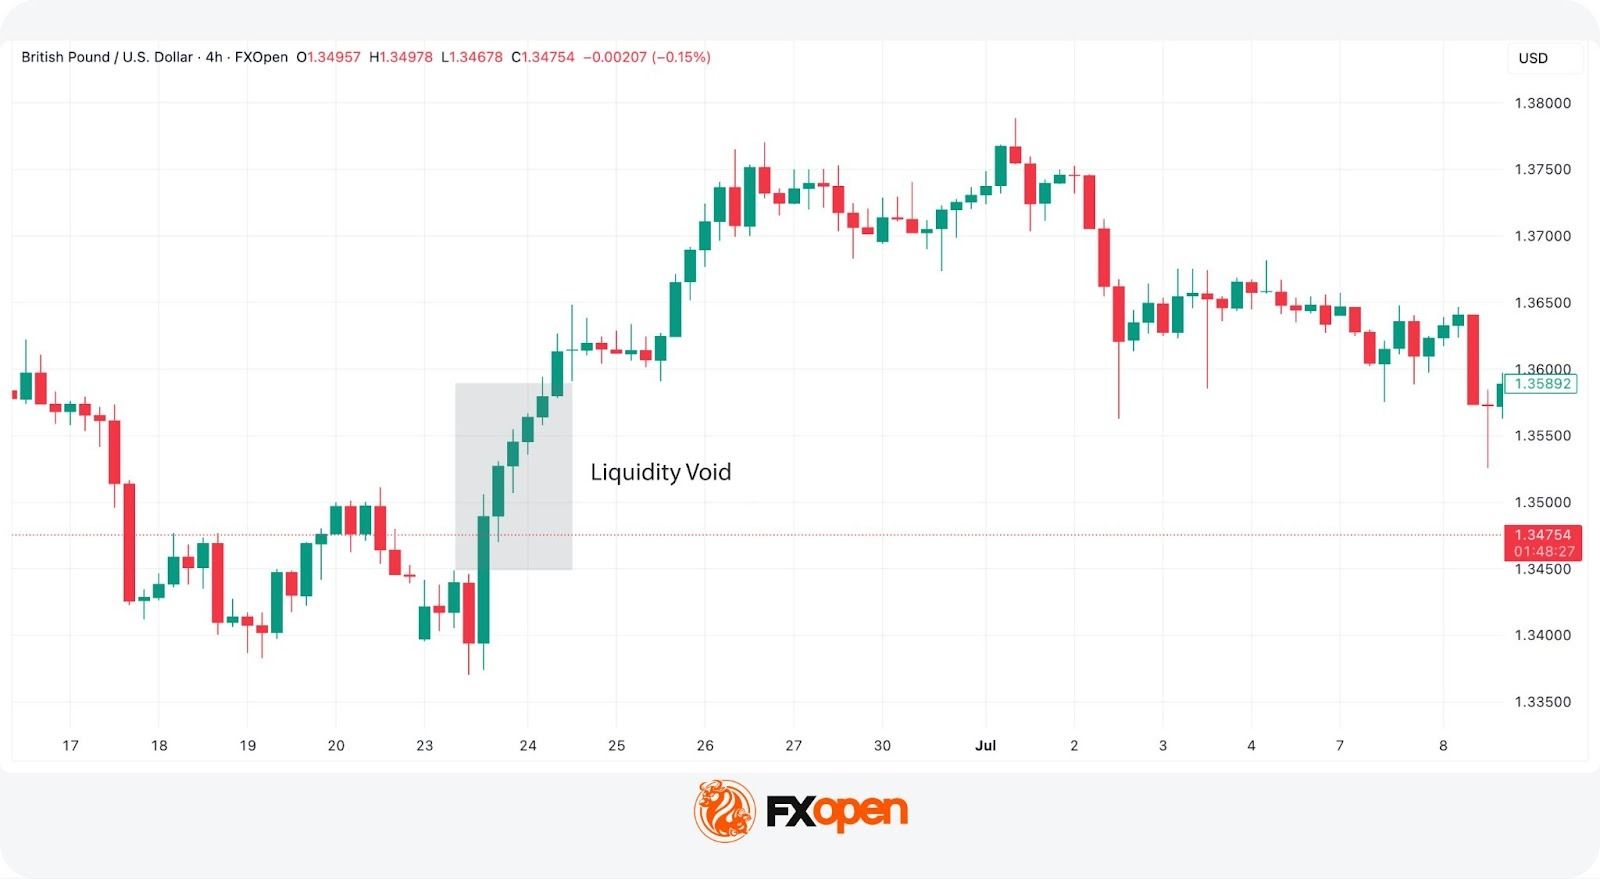
Step 1: Identifying a Higher-Timeframe Liquidity Void
On the 4-hour chart of the GBP/USD pair, a bullish liquidity void is visible where price displaced sharply upward from around 1.3475 to 1.3550, leaving a zone with minimal two-sided trading. This void defines the macro bullish bias and marks an area the market may revisit.
Step 2: Waiting for Displacement on the Lower Timeframe
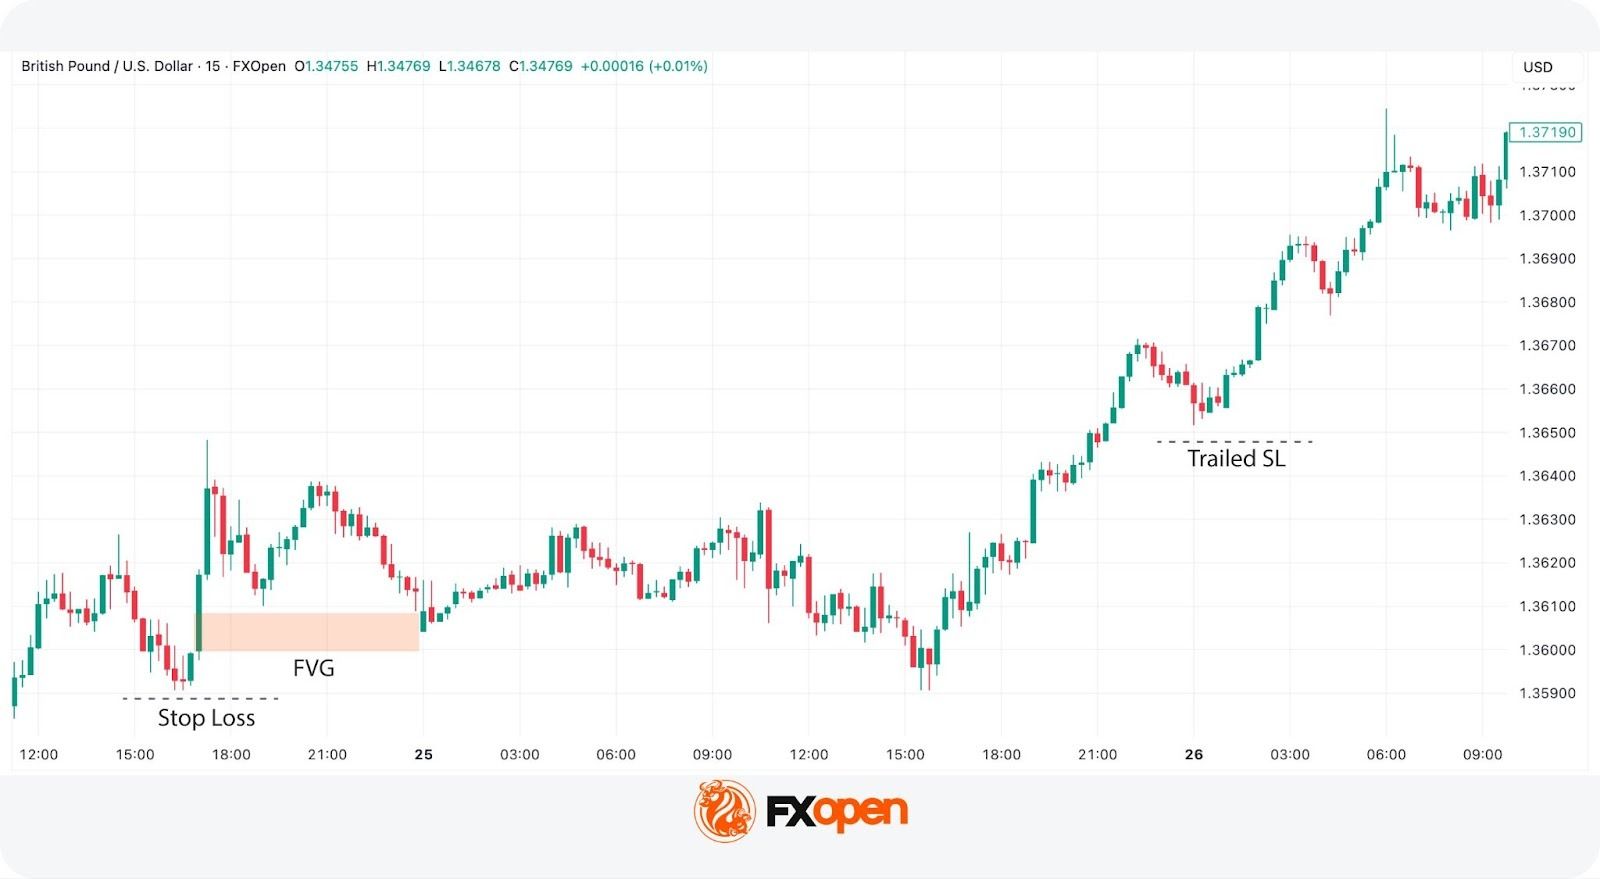
Dropping to the 15-minute chart, a fresh bullish displacement occurs in the same direction as the higher-timeframe void, confirming that buying pressure remains active. This displacement leaves a bullish FVG between approximately 1.3600 and 1.3620.
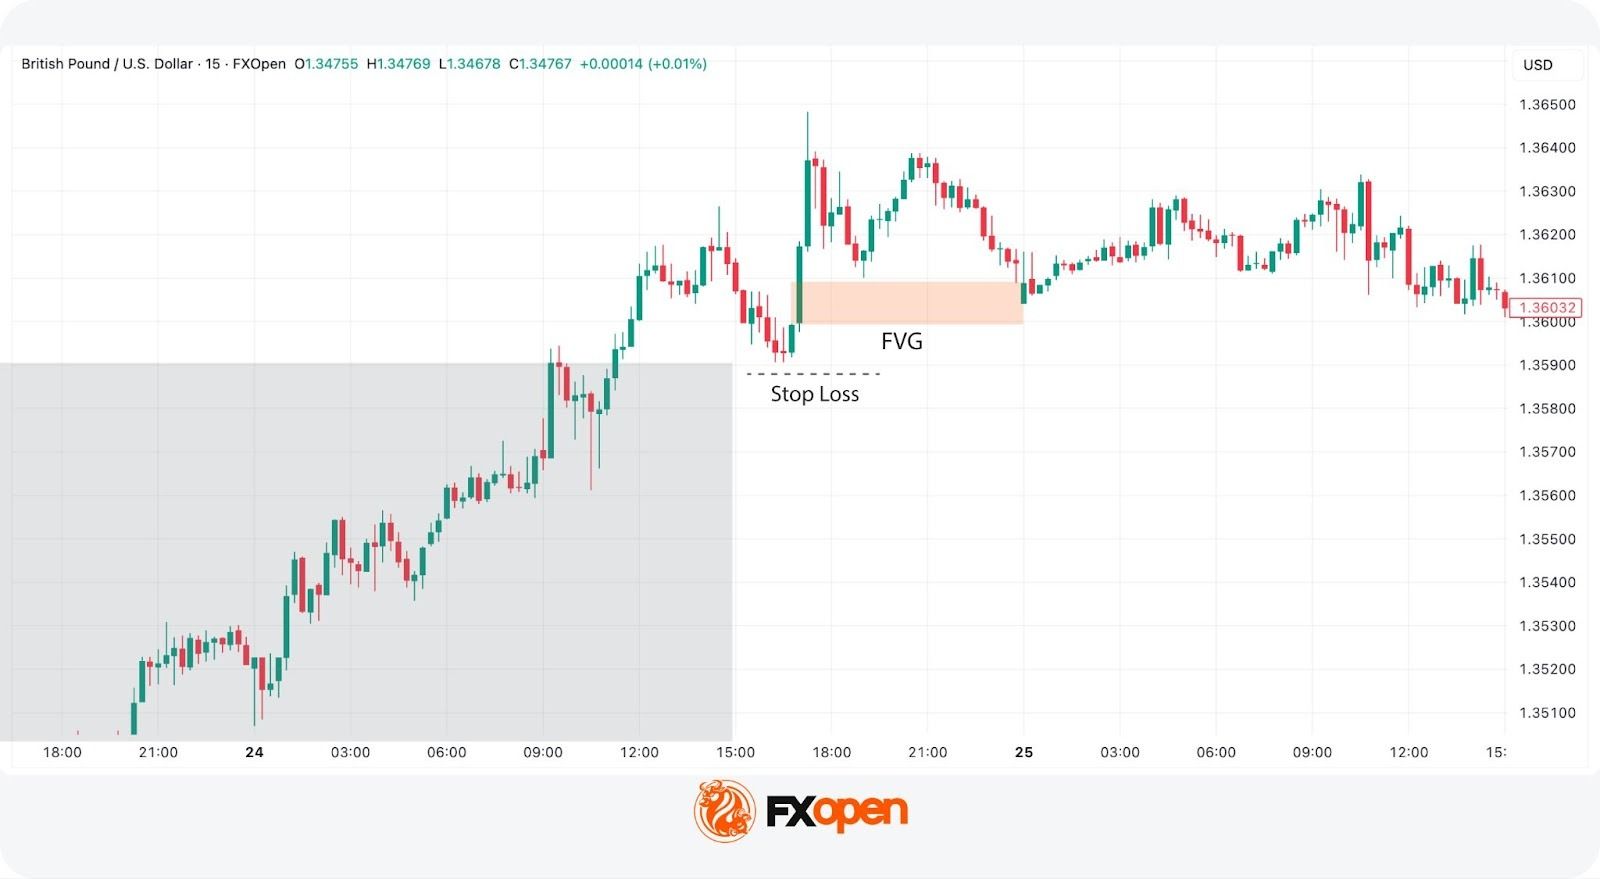
Step 3: Use the FVG for Entry
Price retraces into the 15-minute FVG, offering a potential entry point. A stop loss is placed below the FVG zone if the setup is invalidated.
Step 4: Target Beyond the Void
The position targets the area above the liquidity void where previous trading activity occurred. As the trade moves favourably, the stop loss is trailed to lock in the position.

Limitations of Fair Value Gaps and Liquidity Voids
While fair value gap trading strategies and the analysis of liquidity voids offer insightful approaches to understanding market dynamics, they come with inherent limitations that traders may need to consider:
- Market Volatility: High volatility can unpredictably affect the filling of fair value gaps and liquidity voids, sometimes leading to incorrect analysis or false signals.
- Timeframe Relativity: The significance and potential impact of gaps and voids can vary across different timeframes, complicating analysis.
- Incomplete Picture: Relying solely on these phenomena for trading decisions may result in an incomplete market analysis, as they do not account for all influencing factors.
- Expectations: There is no guarantee that a FVG/void will be filled soon or at any point in the near future.
The Bottom Line
As we conclude, traders should remember that while fair value gap and liquidity void strategies provide valuable insights, they’re part of a broader spectrum of SMC tools. Traders combine them with other analytical techniques to form a comprehensive approach to trading.
If you are looking to delve deeper into trading strategies, you may consider opening an FXOpen account to access a wide array of resources and tools designed to support your trading journey.
FAQs
What Are Fair Value Gaps in Trading?
In trading, fair value gaps reflect moments where market sentiment may strongly favour either buying or selling, creating significant price movement (reflected in a long candle) that hasn’t been traded back.
What Is the Difference Between a Fair Value Gap and a Liquidity Void?
The main difference lies in their scale: a fair value gap is typically a smaller, discrete occurrence, while a liquidity void represents a larger, more pronounced price movement.
How May You Find Fair Value Gaps?
Traders identify fair value gaps by analysing trading charts for areas where rapid price movements have occurred. A FVG consists of three candles, where the second one is the largest and the first and third serve as barriers. The idea of the FVG is that it leads to a potential retracement to fill the gap in the future.
Is a Fair Value Gap the Same as an Imbalance?
Yes, a fair value gap is the same as an imbalance in the Smart Money Concept.
Are Liquidity Voids the Same As Imbalances?
Liquidity voids are a type of imbalance, but not all imbalances are liquidity voids. An imbalance can refer to any zone of one-sided price action, including individual FVGs. A liquidity void specifically describes a larger displacement spanning multiple candles.
Do Fair Value Gaps Always Get Filled?
No. While many FVGs are eventually traded through, some remain unfilled indefinitely. Gaps formed during strong trending conditions or following fundamental shifts in an asset's value may never see a full retracement.
Are Order Blocks the Same As Fair Value Gaps?
No. An order block is the last opposing candle before a displacement move, representing a zone where institutional orders were likely placed. An FVG is the gap left behind by the displacement itself. They often appear near each other but serve different roles in analysis.
How Reliable Are ICT Fair Value Gaps?
FVGs are a commonly used component within the ICT and Smart Money Concept frameworks, but they do not guarantee a specific outcome. Their usefulness tends to increase when combined with confluence factors such as order blocks, market structure shifts, and higher-timeframe alignment.
Can FVGs Be Used in Forex and Crypto*?
FVGs may be applied to any market with candlestick charts, including forex, stocks, and digital assets*. The underlying principle of price imbalance and retracement is not limited to a single asset class, though behaviour may vary across different markets and timeframes.
*Important: At FXOpen UK, Cryptocurrency trading via CFDs is only available to our Professional clients. They are not available for trading by Retail clients. To find out more information about how this may affect you, please get in touch with our team.
This article represents the opinion of the Companies operating under the FXOpen brand only. It is not to be construed as an offer, solicitation, or recommendation with respect to products and services provided by the Companies operating under the FXOpen brand, nor is it to be considered financial advice.
Stay ahead of the market!
Subscribe now to our mailing list and receive the latest market news and insights delivered directly to your inbox.


Latest articles


Market Insights with Gary Thomson: Oil, US Retail Sales & NFP in Focus
In this video, we’ll explore the key economic events and market trends, shaping the financial landscape. Get ready for insights into financial markets to help you navigate the week ahead. Let’s dive in!
In this episode of Market

Geopolitics Fuels Volatility: AUD/USD and USD/CAD Near Key Levels
Commodity-linked currencies continue to weaken amid rising geopolitical tensions, which are boosting demand for safe-haven assets and increasing volatility across both FX and commodity markets. The US dollar is gaining support from demand for liquid and defensive assets, while currencies