


Fear and Greed Indicator in Stock, Forex, and Crypto Trading
FXOpen
In trading, emotions often dictate market dynamics, with fear and greed at the forefront of influencing investor behaviour. This FXOpen article delves into the psychological underpinnings of trading, exploring how these primal emotions not only shape asset trends but also offer opportunities for traders aiming to understand the volatile terrain of stocks, forex, and crypto markets.
The Psychology of Trading: Fear and Greed
The psychology of trading is deeply influenced by two primal emotions: fear and greed. These emotions drive the financial markets and can dictate the behaviour of traders, often leading to dramatic market movements. Fear, for example, can cause a sudden sell-off of assets as traders rush to liquidate their positions to avoid losses, leading to a drop in prices. On the other hand, greed can fuel buying frenzies, pushing prices to unsustainable levels as traders chase after higher returns.
Understanding and managing these emotions is crucial for traders. Those who let fear and greed dominate their decisions may find themselves buying high out of FOMO (Fear Of Missing Out) or selling low in a panic. Conversely, traders who recognise these emotional triggers can potentially improve their strategy by being more disciplined and analytical, making decisions based on data and trends rather than emotional reactions.
However, it’s also possible to take advantage of the market’s emotional reactions by analysing a Fear and Greed Index.
Understanding the Fear and Greed Index
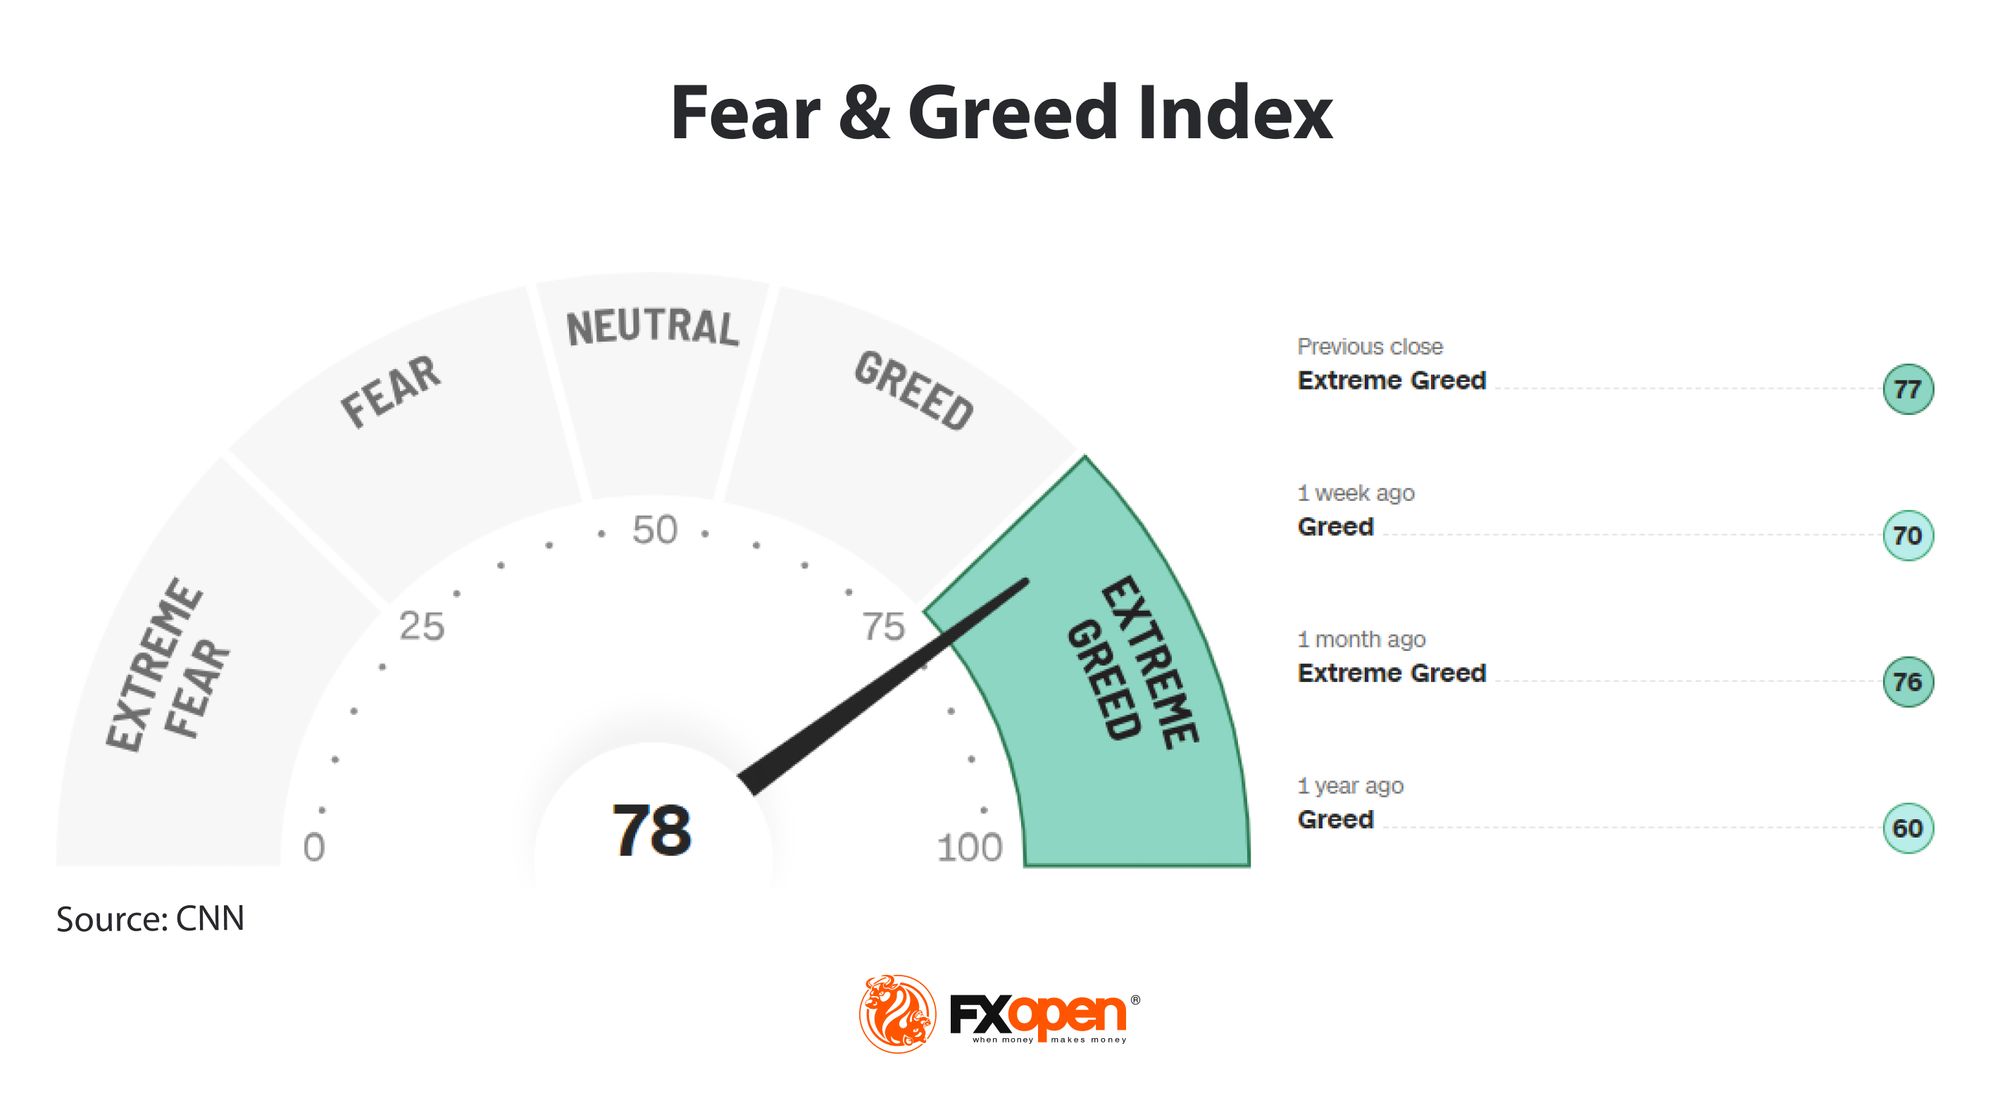
In trading, the Fear and Greed Index stands as a key indicator that displays market sentiment, offering a snapshot of the emotional forces driving investor behaviour. This tool, often referred to as the Fear and Greed indicator or Fear and Greed meter, acts as a barometer for the collective mood of the stock market, oscillating between two dominant emotions: fear, which can drive prices down as investors sell off assets, and greed, which can push prices up as investors clamour to buy more.
The Fear and Greed Index by CNN Business is the most notable version of this indicator. By aggregating data from various market indicators, including volatility, stock price momentum, and stock price strength, among others, the index assigns a numeric value between 0 (extreme fear) and 100 (extreme greed). This quantification helps traders discern whether the US stock market is potentially overvalued—suggesting a sell-off might be imminent—or undervalued, indicating a potential buying opportunity.
How the Fear and Greed Index Is Generated
The calculation of CNN’s Fear and Greed Index involves an intricate analysis of seven key market indicators, each reflecting a different aspect of trader behaviour and sentiment. This multifaceted approach may ensure a comprehensive assessment of the emotional state driving the stock market's movements.
- Market Volatility: Measured by the VIX (CBOE Volatility Index), this component gauges the market's expectation of near-term volatility, reflecting the level of investor fear or complacency.
- Market Momentum: This indicator compares the current performance of the S&P 500 against its 125-day moving average, highlighting whether a price movement is in the upper or lower range of its historical trend.
- Stock Price Strength: By tracking the number of stocks hitting 52-week highs versus those hitting 52-week lows on the NYSE, this metric indicates the market's underlying strength or weakness.
- Stock Price Breadth: The analysis of advancing versus declining shares on the NYSE provides insight into the market's overall direction and momentum.
- Put and Call Options: The ratio of put options against call options measures investor sentiment towards market movements, with a higher ratio potentially indicating fear and a lower ratio potentially suggesting greed.
- Junk Bond Demand: The spread between yields on junk bonds and investment-grade bonds offers clues about investor risk appetite, with narrower spreads indicating greed.
- Safe Haven Demand: By comparing the performance of stocks against so-called safer investments like treasury bonds over the past 20 trading days, this factor assesses the market's risk preference.
Each indicator contributes to a final score on a scale from 0 to 100. The stock market Fear and Greed Index aggregates these scores, providing insights into the prevailing sentiment at any given time.
Using Stock Market Sentiment for Stock Trading
The Fear and Greed Index can be instrumental for traders looking to navigate the stock market's emotional landscape. Particularly, the extremes of fear and greed provide critical signals, indicating potential market corrections and offering opportunities for a contrarian trading approach.
When the index reads extreme fear, it may suggest the market is oversold, with investors dumping shares hastily, possibly below their true value. This scenario can present a golden opportunity for traders to buy high-quality stocks at lower prices, anticipating a rebound as sentiment improves.
Conversely, extreme greed often signifies an overbought market where stocks may be priced above their intrinsic value, driven by excessive optimism. Here, traders might consider selling or reducing exposure to secure gains before the inevitable sentiment reversal and market pullback. This approach aligns with the contrarian philosophy of going against the tide, exploiting the emotional extremes for potential returns.
Beyond these extremes, even moderate readings of greed or fear can guide trading direction. Generally, greed leads to a rising stock market and vice versa. When the market is simply greedy or fearful, traders can use this momentum to set a directional bias and time their trades effectively, anticipating that the market will eventually move into extreme greed or fear territory.
Moreover, the Fear and Greed Index helps traders discern the market's risk appetite, particularly towards sectors. For instance, a tilt towards greed may see risk-on sectors like technology and consumer discretionary outperform as investors chase higher returns. In contrast, readings leaning towards fear may benefit risk-off sectors like consumer staples and healthcare, known for their potential stability.
Fear and Greed in Forex Trading
In the realm of forex trading, the absence of a universally recognised Fear and Greed Index, akin to what exists for the stock market, is notable. This absence stems from the forex market's decentralised nature, encompassing a global network of traders and banks without a single exchange or metric that captures the collective sentiment as neatly as the stock market's indexes do.
However, forex traders are not left in the dark regarding market sentiment. Various sentiment indicators, such as those offered by Myfxbook, provide a glimpse into the emotional undercurrents of forex markets. These tools analyse the positioning and sentiment of traders, allowing for a contrarian approach where one might trade against extreme sentiment signals, mirroring strategies used with the stock market's Fear and Greed Index.
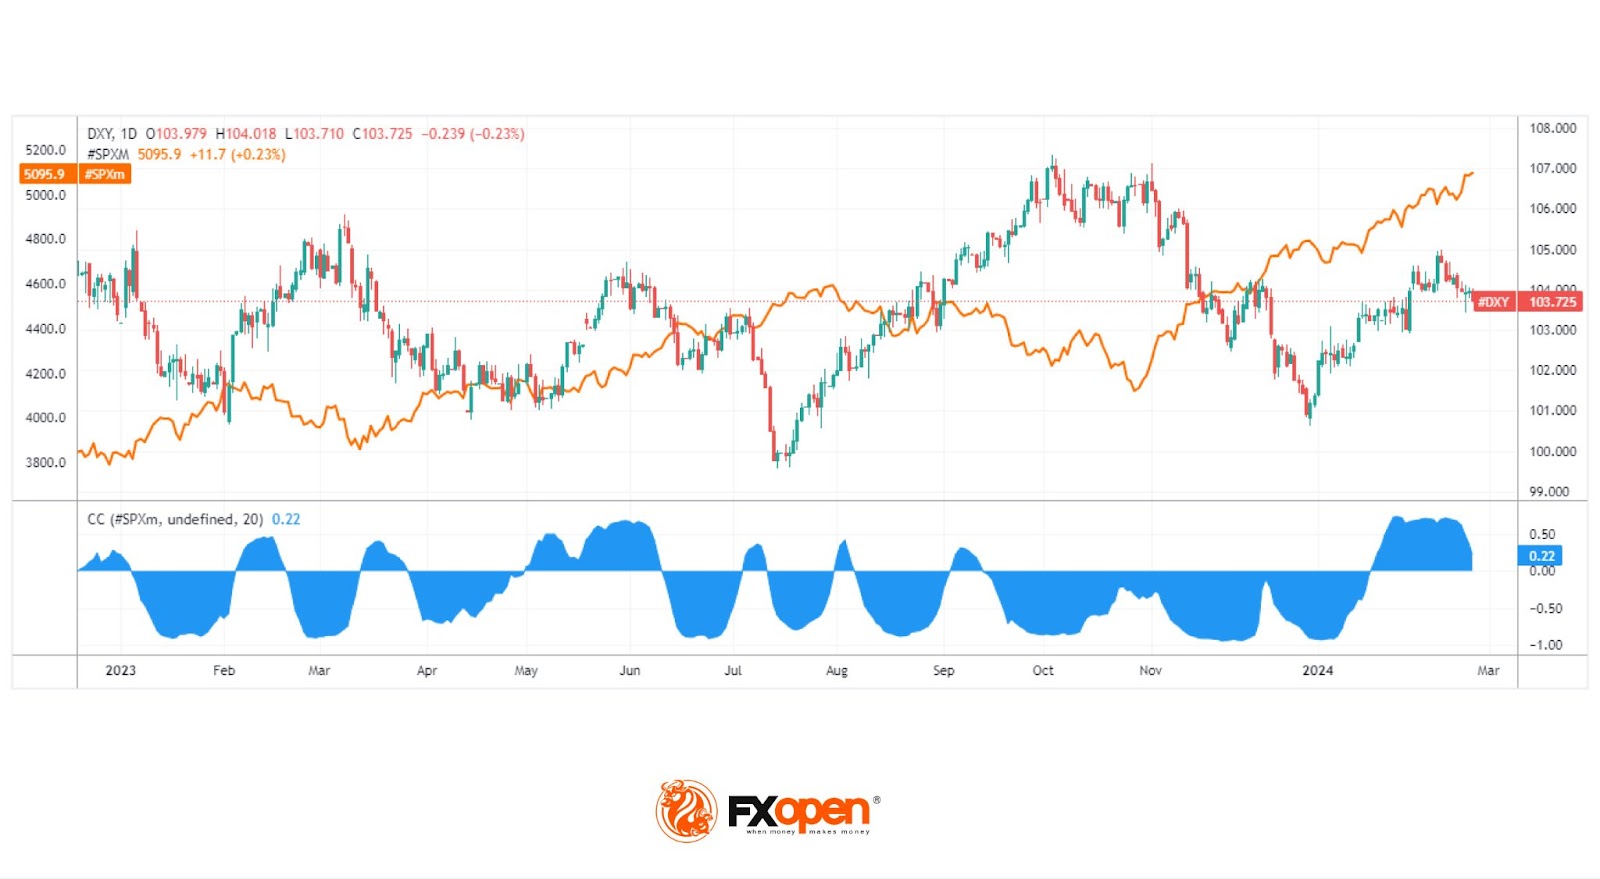
Forex traders can still extrapolate insights from CNN's Fear and Greed Index, especially regarding the US dollar's movements. Often, the dollar moves inversely to the S&P 500 due to risk sentiment; when stocks are in demand (greed), investors are more likely to sell off so-called safer assets like the US dollar in pursuit of higher returns, leading to a weaker dollar. Conversely, a fearful stock market retreat can bolster the dollar as investors flock to the potential safety of cash and bonds.
While this correlation isn't flawless, it provides a useful barometer for forex traders to gauge potential shifts in the dollar's trajectory. Traders can explore this correlation in FXOpen’s free TickTrader platform; just compare DXY (the US dollar index) against SPXm (the S&P 500) to get started.
Fear and Greed in Crypto
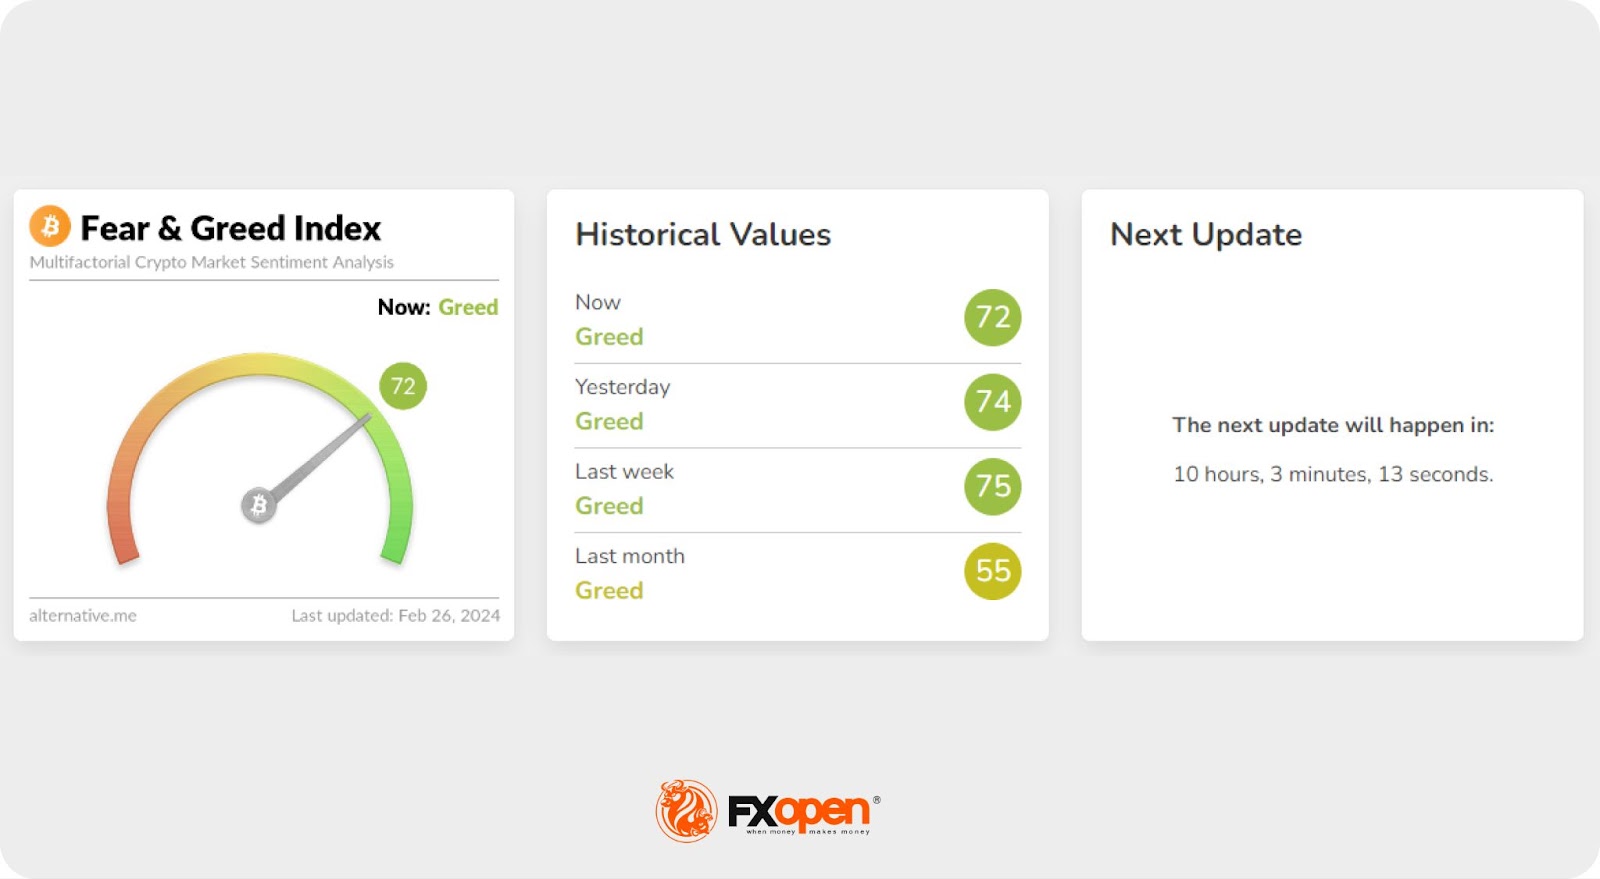
For cryptocurrency trading*, sentiment analysis arguably plays an even bigger role than in stocks or forex. The go-to crypto Fear and Greed Index is Alternative.me’s, which is specifically tailored for Bitcoin. Given that the rest of the crypto market typically moves in step with Bitcoin, this index can be a valuable resource for digital asset traders.
Alternative.me’s Fear and Greed Index for Bitcoin is constructed using various factors to gauge the emotional state of the market. These factors include:
- Volatility: Bitcoin's present volatility and maximum drawdowns are compared with average values from the prior 30 and 90 days. An increase in volatility often signals a fearful market.
- Market Momentum/Volume: This combines current volume and market momentum, compared against 30/90-day averages. High buying volumes in a positive market indicate a market that is overly greedy or bullish.
- Social Media: Analysis of Twitter interactions on hashtags related to specific coins, especially Bitcoin. A high interaction rate may suggest growing public interest and greedy market behaviour.
- Dominance: The dominance of a coin resembles the market capitalisation share of the entire cryptocurrency market. Increasing Bitcoin dominance may suggest a fear-driven retreat from speculative altcoin investments, viewing Bitcoin as a so-called safe haven.
- Trends: Utilisation of Google Trends data for Bitcoin-related searches. Significant changes in search volume or the emergence of fear-related queries indicate bearish market sentiment.
Cryptocurrencies, more speculative and volatile than traditional stocks or fiat currencies, are heavily influenced by sentiment. Unlike stocks, which have intrinsic value, or currencies, integral to global finance, cryptocurrencies' speculative nature makes them highly susceptible to the emotional currents of investors. For instance, just before Bitcoin hit its all-time high of around $69,000, Alternative.me's index displayed an extreme greed rating of 84, showcasing the critical impact of sentiment.
Like its stock market counterpart, Fear and Greed in cryptocurrency is most useful at its extremes, helping traders identify potential market corrections or rallies. However, even moderate levels of fear or greed can indicate the market's trending direction, offering traders insights into when to enter or exit trades based on the prevailing mood.
The Bottom Line
Mastering the psychological aspects of trading, particularly understanding the influence of fear and greed, can potentially enhance decision-making and performance in the markets. The tools discussed provide valuable insights into market sentiment, offering traders an extra clue about where a particular asset might be headed. For those looking to apply these insights practically, opening an FXOpen account offers a gateway to the forex, stock, and crypto* markets via CFDs, backed by advanced trading tools. Happy trading!
FAQs
What Does the Fear and Greed Index Measure?
The fear and greed index measures market sentiment, indicating whether investors are driven by fear (potential undervaluation) or greed (possible overvaluation).
How Is the Fear and Greed Index Calculated?
It's calculated using various market indicators such as volatility, market momentum/volume, demand for risk-on/risk-off assets, and more.
What Is the Fear and Greed Meter in Crypto?
The crypto fear and greed index, like Alternative.me's Bitcoin index, assesses the emotional climate of the cryptocurrency market.
What Is the Fear Index in Forex?
While no direct fear index exists for forex, sentiment indicators measure trader emotions that can potentially impact currency price movements.
What Is the Best Fear and Greed Indicator?
The best indicator depends on your market focus but generally combines several data points to accurately reflect market sentiment. The most popular fear and greed indicators are CNN's for stocks and Alternative.me's for cryptocurrencies.
*At FXOpen UK and FXOpen AU, Cryptocurrency CFDs are only available for trading by those clients categorised as Professional clients under FCA Rules and Professional clients under ASIC Rules, respectively. They are not available for trading by Retail clients.
This article represents the opinion of the Companies operating under the FXOpen brand only. It is not to be construed as an offer, solicitation, or recommendation with respect to products and services provided by the Companies operating under the FXOpen brand, nor is it to be considered financial advice.
Stay ahead of the market!
Subscribe now to our mailing list and receive the latest market news and insights delivered directly to your inbox.


Latest articles

Weekly Market Insights with Gary Thomson: US Inflation, UK GDP, Chair Warsh Testimony, and Earnings
In this video, we’ll explore the key economic events and market trends, shaping the financial landscape. Get ready for insights into financial markets to help you navigate the week ahead. Let’s dive in!
In this episode of Market

GBP/AUD Analysis: The Tug-of-War Begins
Oil is back in the driver's seat, and both the pound and the aussie are feeling its grip. The Bank of England held rates at 3.75% in June, but with UK inflation at 2.8% and crude oil climbing

Australian Dollar Holds Above the Current Market Profile
The minutes from the Reserve Bank of Australia's (RBA) June meeting, released on 30 June, suggested that policymakers are not yet ready to rule out further policy tightening. Board members noted persistent excess demand and broad-based inflationary pressures across the