


Fib Circles in Trading
FXOpen
Fibonacci circles, a unique tool in the trading arsenal, offer a compelling blend of technical analysis and mathematical beauty. Rooted in the Fibonacci sequence, they provide traders with a distinct perspective on market trends and potential reversal points. This article delves into the practical application of Fibonacci circles, shedding light on how they can be integrated with other trading tools for more nuanced insights.
Background on the Fibonacci Sequence and Its Application in Trading
The Fibonacci sequence, discovered by Leonardo of Pisa in the 13th century, is a series where each number is the sum of the two preceding ones, starting from 0 and 1. This sequence, 0, 1, 1, 2, 3, 5, 8, 13, 21, and so forth, holds a mathematical ratio commonly found in nature, art, and architecture. In the financial markets, these ratios, particularly the 61.8% (often referred to as the “golden ratio”), 38.2%, and 23.6%, are used in Fibonacci-based trading methods.
Traders apply these ratios to identify potential reversal levels on price charts, believing that markets might retract or extend by these Fibonacci percentages after a price movement. This belief stems from the observation that financial markets often exhibit patterns and structures that resonate with Fibonacci's mathematical harmony, leading traders to use these ratios for analysing future price movements.
Understanding Fib Circles
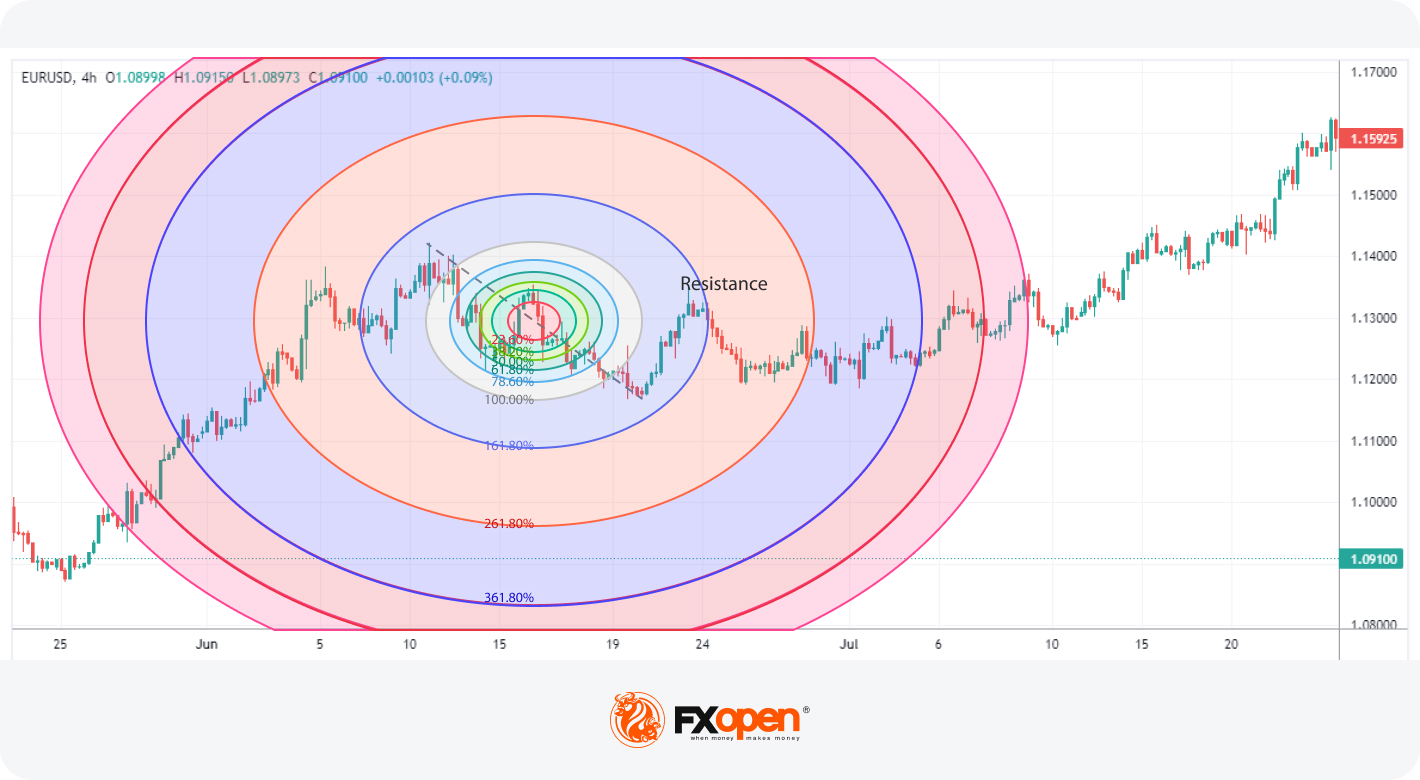
Using the Fibonacci sequence, circles can be created. They overlay circular arcs onto a price chart, where each arc represents a potential support or resistance level based on Fibonacci ratios. To construct a Fibonacci circle, one first identifies two significant price points, typically a high and a low. From these points, a circle is drawn, expanding outward in arcs that expand in proportion to the Fibonacci ratios.
The arcs intersect the price axis at key levels, like 38.2%, 50%, and 61.8%, suggesting areas where the market price might experience support or resistance. Extension levels, like 161.8% and 423.6%, are also commonly plotted. This tool is particularly valuable in identifying potential reversal points in market trends.
The Fibonacci spiral circle adds another dimension to analysis, though it’s a separate tool. It visually represents the natural spiral found in the Fibonacci sequence. These spirals can help traders anticipate the speed and trajectory of a price movement within the context of a broader trend.
How to Use Fib Circles in Trading
When utilising trading circles, traders often begin by selecting two significant points on the chart, such as a high and a low. In a bullish trend, this is from a recent swing high to a previous low; in a bearish trend, it’s from a recent swing low to a prior high. The distance between these points is divided by Fibonacci ratios, creating a series of concentric circles. Each represents a potential level where price action might stall or reverse.
Traders typically use these circles to gauge market sentiment and potential trend changes. When the price approaches or touches a level, many prefer to observe the market's reaction, looking for signs of support or resistance. If the price bounces off the line, it could indicate a potential reversal point.
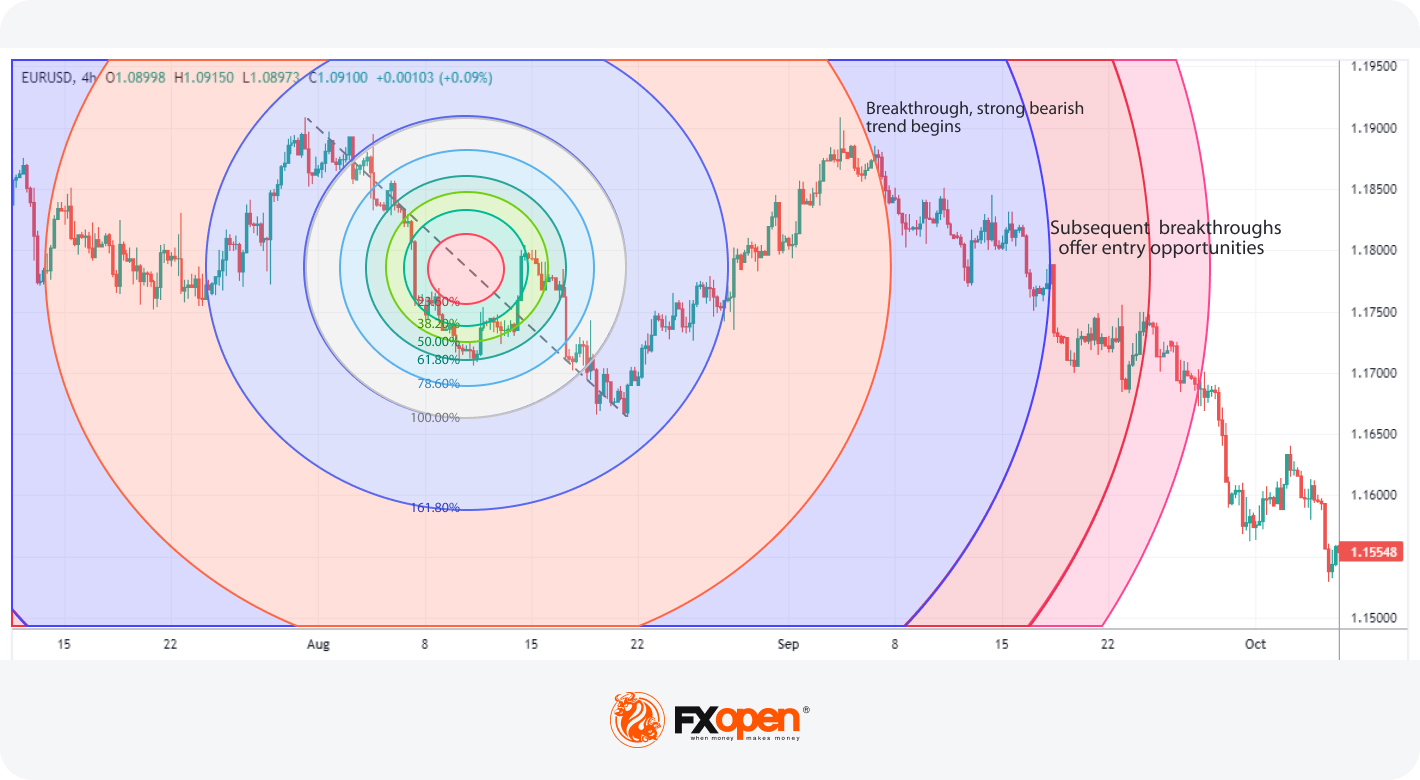
In addition to identifying support and resistance, Fib circles can offer insights into the strength of a trend. A strong trend might see the price break through several levels, while a weakening trend could struggle to surpass them.
While Fibonacci circles can be a valuable tool, traders recognise the importance of context. Market conditions, news events, and other technical indicators are considered alongside these circles. They, therefore, are not standalone predictive tools but part of a broader analytical approach in trading.
Integrating Fib Circles with Other Technical Analysis Tools
Incorporating Fibonacci circles into a broader technical analysis framework enhances their effectiveness in trading. Traders often combine them with other tools for a more comprehensive market analysis. Head over to FXOpen’s free TickTrader platform to get started with over 1,200+ of these trading tools.
One common integration is with moving averages, which help in identifying the prevailing market trend. For example, when a Fib circle level aligns with a key moving average, it can signal a stronger potential support or resistance area.
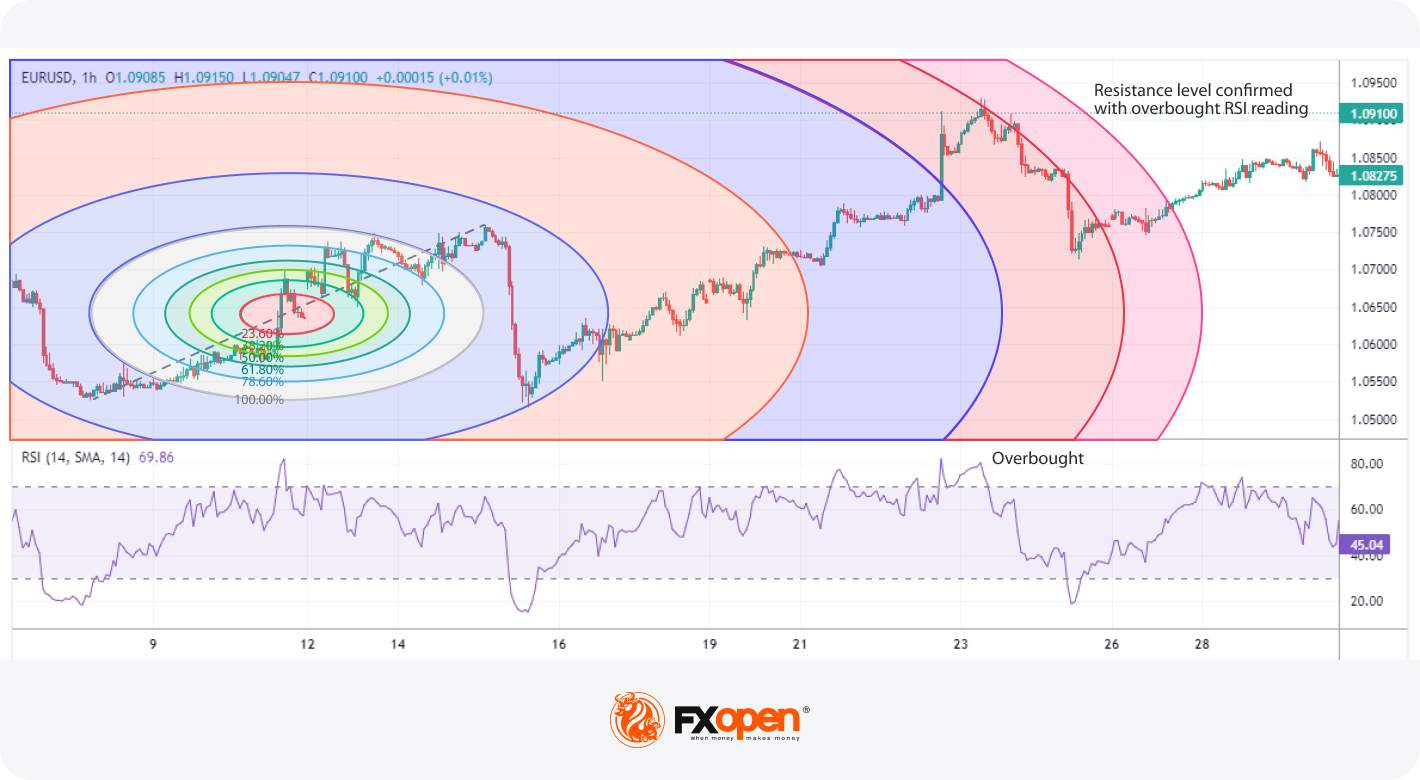
The Relative Strength Index (RSI) is another tool that pairs well with Fibonacci circles. When the RSI shows overbought or oversold conditions and the price reaches a Fib circle level, it may indicate a higher likelihood of a price reversal.
Additionally, candlestick patterns are utilised in conjunction with Fibonacci circles to validate potential reversal signals. The presence of a bullish or bearish candlestick pattern at a key level can provide further confirmation of a trade opportunity.
Best Practices for Using Fib Circles
Using Fib circles effectively requires specific strategies. Here are some practices you may want to know:
- Accurate Placement: Make sure the starting points for the Fibonacci circles are accurately placed at significant highs and lows. This accuracy is crucial for relevant support and resistance levels.
- Context Consideration: It’s best to use Fib circles in conjunction with overall market trends and patterns. They aren’t the only consideration when entering a trade.
- Confirmation: Wait for price action confirmation when the price reaches a notable level. Candlestick patterns or other indicators can support the potential reversal or continuation.
- Adjustment and Flexibility: Be prepared to adjust the circles as new highs and lows form. Market dynamics are constantly evolving, and flexibility is key.
- Conservative Use in High Volatility: During periods of high market volatility, it’s a good idea to be more conservative in interpreting Fib circles, as price swings can be erratic and less predictable.
The Bottom Line
In conclusion, mastering Fibonacci circles can greatly enhance your market analysis. These tools, when used effectively, offer deeper insights into market trends and potential reversals. For traders looking to apply these strategies in real-time markets, opening an FXOpen account can be a valuable step. We provide high-speed execution and tight spreads to put these techniques into practice and refine your trading skills. Happy trading!
This article represents the opinion of the Companies operating under the FXOpen brand only. It is not to be construed as an offer, solicitation, or recommendation with respect to products and services provided by the Companies operating under the FXOpen brand, nor is it to be considered financial advice.
Stay ahead of the market!
Subscribe now to our mailing list and receive the latest market news and insights delivered directly to your inbox.


Latest articles

GBP/CHF: Trendline or RSI — Which One Is Lying?
Sterling enters this week on firmer footing, with political uncertainty fading fast after Andy Burnham's confirmation as Labour leader eased investor concerns over the succession to Keir Starmer. Markets reacted further to reports pointing to Shabana Mahmood as the frontrunner

Silver Attempts to Break Out of Its Range
Silver continues to balance between its dual role as an industrial metal and so-called refuge asset, and this combination largely explains the lack of a clear trend in recent weeks. Shifting expectations for central bank interest rates can influence the

Nasdaq 100: Is This the Correction Traders Have Been Waiting For?
The Nasdaq 100 (US Tech 100 Mini on FXOpen) remains caught between two opposing forces: cooling inflation on one side, and persistent geopolitical instability on the other. On 14 July, June's CPI print came in softer than expected, easing near-term