


Forex Market Sentiment Strategies
FXOpen

In forex trading, high performance often hinges not only on fundamental knowledge and technical analysis skills but also on the collective psychology of market participants. Leveraging market sentiment can thus be effective. This article discusses forex market sentiment, unravelling its nuances, exploring key indicators and sources, and offering strategies you may use to integrate sentiment analysis with technical indicators.
Understanding Forex Market Sentiment
Market sentiment in forex encompasses the collective mood and attitude of traders towards a particular currency pair. Traders often categorise market sentiment into various types, primarily:
- Bullish Sentiment: Indicates an optimistic outlook, where traders expect the price of a currency to rise.
- Bearish Sentiment: Reflects a pessimistic outlook, suggesting that participants expect a currency's value to decline.
Market Sentiment Indicators and Sources
Sentiment analysis in trading requires research into specific indicators and data sources, allowing for the integration of market psychology with objective market data.
News Sentiment
News data can be a powerful catalyst. Positive or negative surprises in economic indicators can trigger significant market reactions. Geopolitical events and trade negotiations also introduce uncertainty, prompting traders to reassess their positions. Breaking news related to economic policies and political issues can additionally trigger rapid market movements. Traders typically utilise an online Economic Calendar and follow reputable media sources to stay organised and informed about upcoming events.
Social Media Sentiment
The rise of social media has given traders a new avenue to express and gather sentiment. Platforms like X (formerly Twitter), Reddit, and Discord can provide valuable insights. However, filtering through the noise becomes imperative to distil relevant insights. You may consider relying on information from multiple social media platforms to cross-verify sentiments and distinguish informed analysis from speculative chatter.
Retail Trader Sentiment
Retail traders, often considered the "crowd", collectively shape sentiment through their actions and reactions. However, monitoring retail trader sentiment can provide contradictory signals, as both excessive bullishness and bearishness may indicate a potential reversal. It may be useful to look for divergence between retail sentiment and prevailing market trends, as a significant misalignment might indicate a potential reversal.
Institutional Sentiment
Institutional investors, comprising hedge funds, investment banks, and large financial institutions, often operate on a scale that dwarfs individual and retail traders, executing large trades that can significantly impact market prices. Traders may enhance their forex sentiment analysis tools by accessing reports, such as the Commitments of Traders (COT) report, to gauge sentiment by checking whether institutions are accumulating long or short positions.
You can visit FXOpen and explore the impact of sentiment on the markets at the free TickTrader trading platform.
Forex Sentiment Strategies
Among the technical indicators that can be used to evaluate the prevailing mood are the Advance/Decline Line, the On Balance Volume (OBV), and the Average True Range (ATR). Below we show three strategies implementing each of them.
The Contrarian Strategy
The contrarian strategy involves taking positions against the prevailing market sentiment, aiming to take advantage of potential reversals. Three key technical indicators employed in this strategy are the Relative Strength Index (RSI), the Moving Average Convergence Divergence (MACD), and the Advance/Decline Line.
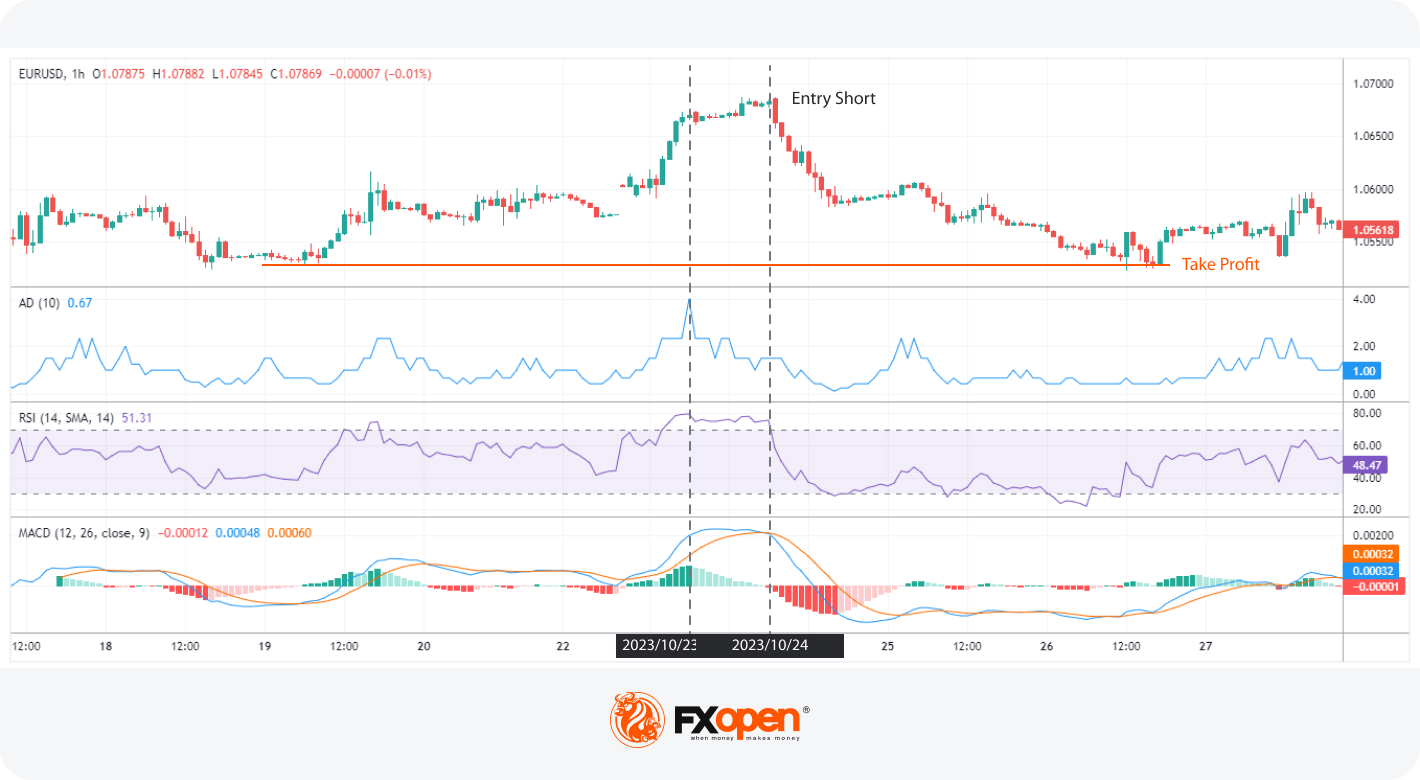
Entry
The theory states that traders enter a contrarian long/short position when both RSI and MACD provide signals opposing the prevailing sentiment: bearish/bullish crossover for MACD and a cross below the overbought area and above the oversold area for RSI. Entry points are confirmed with signals through a divergence of the Advance/Decline Line: this should decline when the asset price rises and climb when the asset price falls.
Stop Loss
A stop-loss order may be placed above the recent swing high in a bearish contrarian trade or below the recent swing low in a bullish contrarian trade.
Take Profit
A take-profit order may be placed near a significant resistance/support level for a long/short trade.
Trend-Following Strategy
The trend-following strategy involves aligning positions with the prevailing market sentiment, anticipating that established trends will continue. The two technical indicators employed in this strategy are the On-Balance Volume (OBV) and the Moving Average Convergence Divergence (MACD).
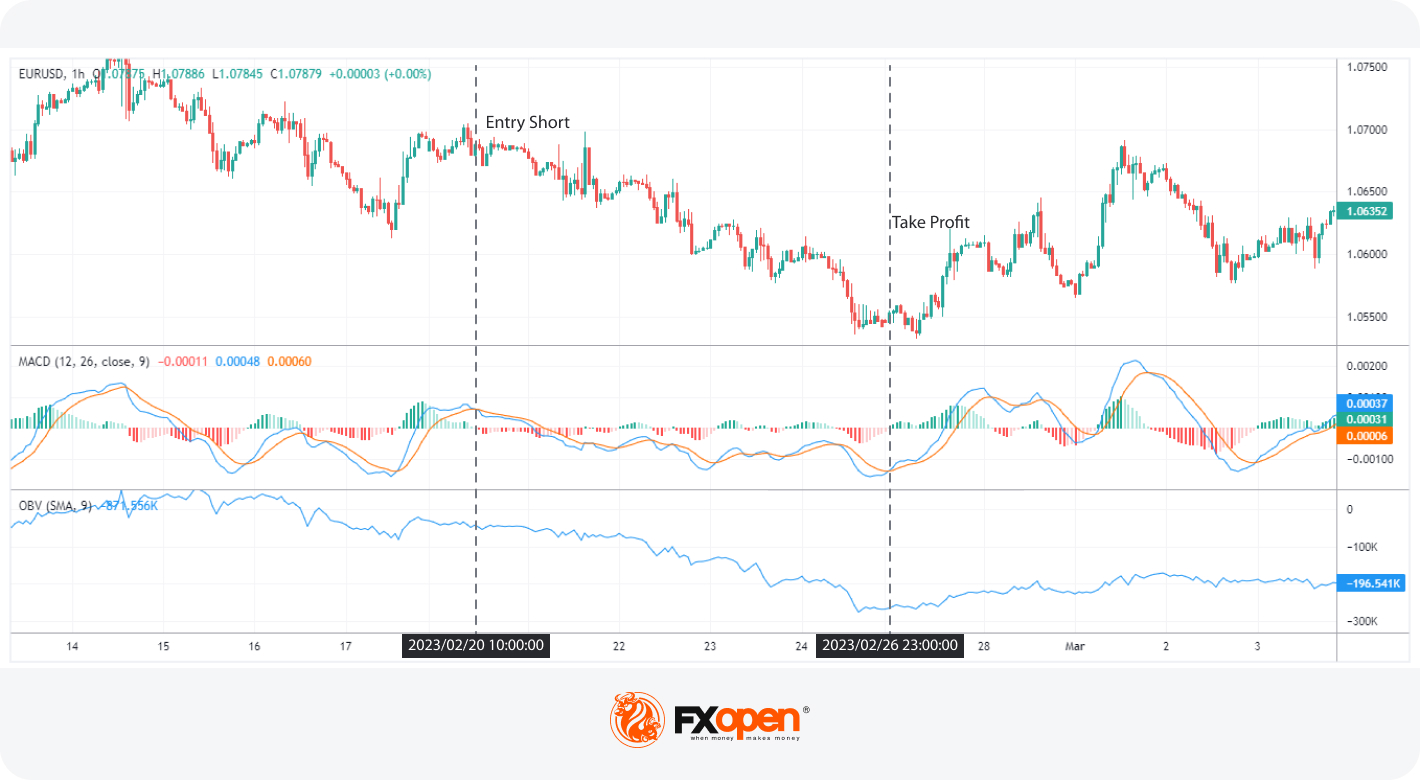
Entry
Traders may enter a trend-following long/short position when both OBV and MACD provide signals aligning with the prevailing trend. If the market sentiment is bullish/bearish, a rising/falling OBV and a bullish/bearish MACD crossover may imply the trend is about to continue.
Stop Loss
A stop-loss order might be placed below the recent swing low in a bullish trade or above the recent swing high in a bearish trade.
Take Profit
An opposite MACD crossover combined with signs of an OBV reversal could indicate a potential take-profit level.
Volatility-Based Strategy
Traders utilising a volatility-based trading strategy seek to capitalise on heightened market volatility triggered by a sudden surge in bullish or bearish sentiment. This strategy utilises the Average True Range (ATR) indicator in conjunction with the Relative Strength Index (RSI) as a confirmation tool and a Moving Average crossover for directional guidance.

Entry
Traders would wait for a noticeable spike in the ATR as an indication of heightened market activity and potential significant moves. Then, a Moving Average crossover helps determine the likely direction of the trade: a bullish/bearish crossover reflects a potential upward/downward move, implying a long/short trade. The RSI is observed for confirmation, with a sharp rise/decline above/below 50 confirming a bullish/bearish sentiment for a short/long trade.
Stop Loss
Traders might place stop-loss orders just beyond recent swing highs or lows, aligning with the direction of the trade to manage risk effectively.
Take Profit
A long/short trade may be exited when there's a bearish/bullish MA crossover combined with RSI falling/rising below/above 50.
Final Thoughts
Implementing sentiment analysis in forex trading strategies acts as a bridge, seamlessly integrating human psychology with dry statistical data, allowing traders to decipher the emotional undercurrents that influence market movements. Ready to start trading on market sentiment? Consider opening an FXOpen account and trying out CFD trading in over 600 assets!
This article represents the opinion of the Companies operating under the FXOpen brand only. It is not to be construed as an offer, solicitation, or recommendation with respect to products and services provided by the Companies operating under the FXOpen brand, nor is it to be considered financial advice.
Stay ahead of the market!
Subscribe now to our mailing list and receive the latest market news and insights delivered directly to your inbox.


Latest articles

AUD/CAD: Months of Indecision — Is a Breakout Finally Coming?
The Australian dollar has clawed back most of its end-of-June losses, when it touched three-month lows against the greenback amid escalating Middle East tensions. Since then, sentiment has improved: the RBA's Assistant Governor Sarah Hunter signalled the board stands ready

USD/JPY: Battling at the Top of the Triangle
On 3 July, Japan's Finance Minister, Satsuki Katayama, stated that the Ministry of Finance remains in close contact with US authorities regarding developments in USD/JPY as the yen traded near its weakest level in almost 40 years. Similar verbal

Dow Jones (DJIA): Consolidation Beyond the Trend
Federal Reserve Chair Kevin Warsh testified before Congress on 14–15 July, reaffirming the Fed's commitment to bringing inflation back to target while providing no clear guidance on the future path of interest rates. Meanwhile, June inflation data came in