


Four of the Most Effective Swing Trading Strategies
FXOpen
Swing trading captures the attention of traders seeking to take profit from short- to medium-term price swings in a more relaxed approach than day trading or scalping. In this article, we explore some popular swing trading strategies, offering insights into how one can use both upward and downward price movements effectively.
Moving Averages Crossover with RSI Confirmation
This swing trading strategy combines the reliability of MA crossovers with the momentum and overbought/oversold conditions identified by the RSI. It aims to capture price swings while reducing the risk of false signals. We will apply this strategy on a 4-hour chart using two of the best moving averages for swing trading for the crossover signals. These are the 20-period and 50-period Exponential Moving Averages (EMA). The RSI with a standard 14-period setting is used for signal confirmation.
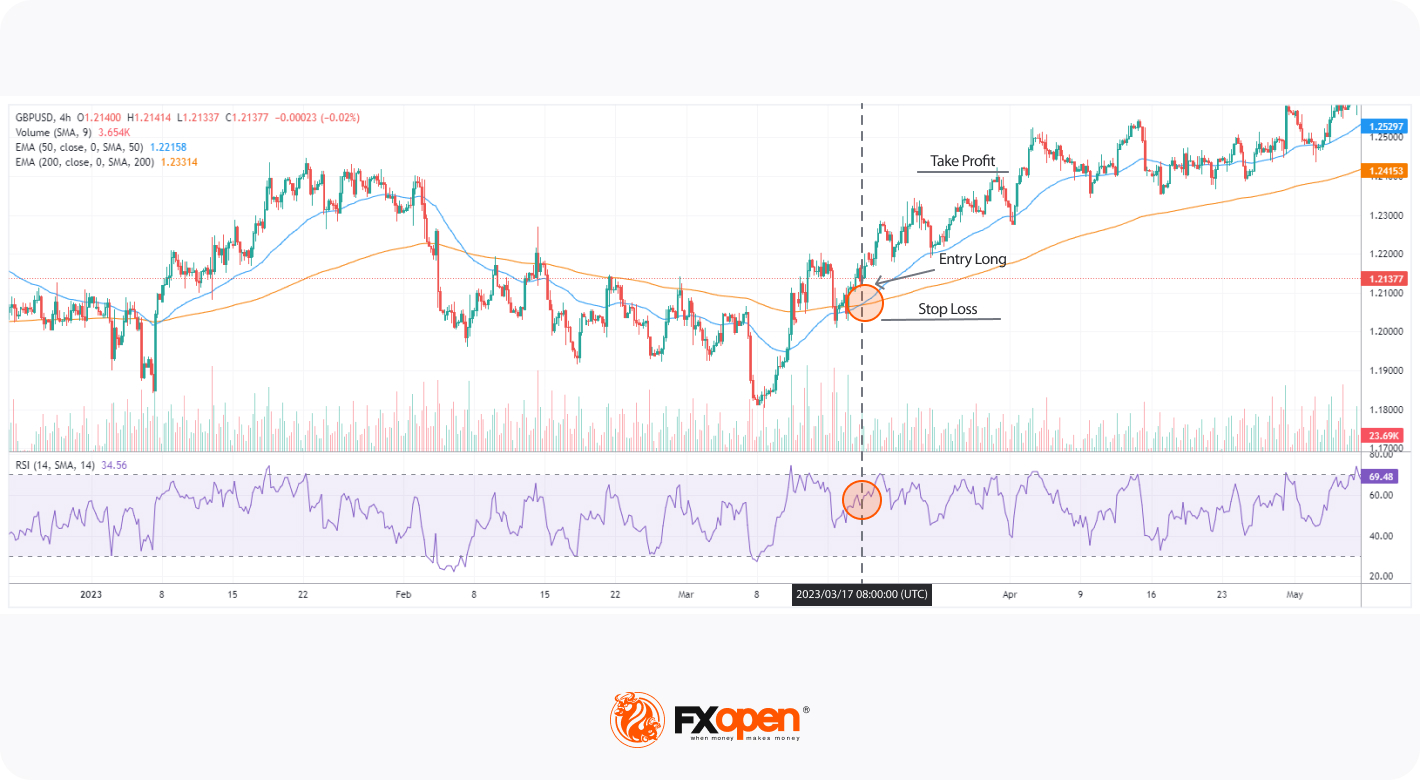
Entry long: When the short-term EMA crosses above the long-term EMA, it generates a bullish signal. When the RSI is above 50 but not yet in the overbought zone (typically above 70), it confirms the bullish momentum.
Entry short: When the short-term EMA crosses below the long-term EMA, it generates a sell signal. When the RSI is below 50 but not yet in the oversold zone (typically below 30), it confirms the bearish momentum.
Stop-loss orders are typically set below a recent swing low for long positions and above a recent swing high for a short position. Take-profit points may be set near the next key resistance level for long trades and near the next support level for short trades.
Looking for the best indicator for swing trading? Head over to FXOpen’s free TickTrader platform and try out the tools available!
Swing Trading Using Fibonacci Levels and a Double Bottom Pattern
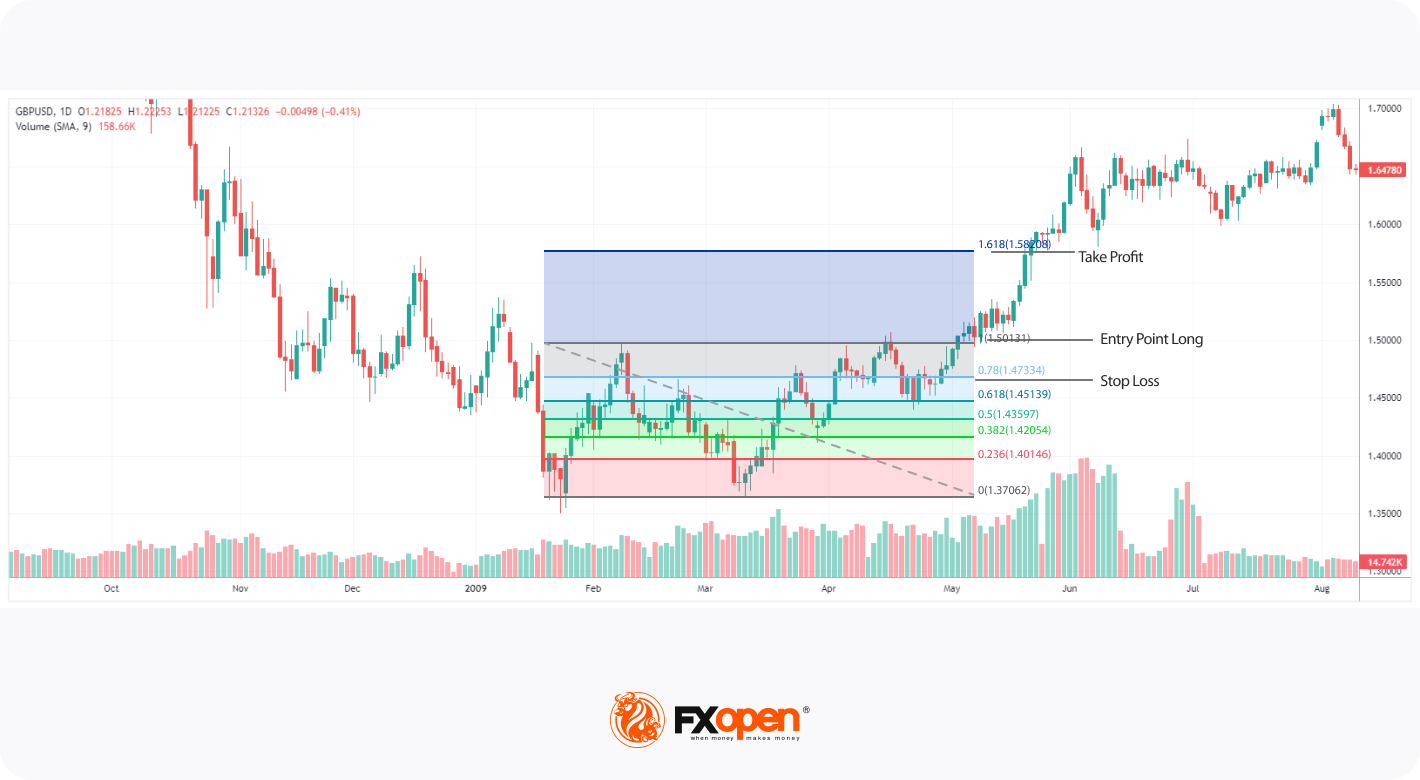
This popular strategy combines Fibonacci levels with the double bottom chart pattern. It can be applied on any time frame for swing trading. The double bottom chart pattern consists of two price troughs at approximately the same levels, separated by a peak. This pattern suggests a trend reversal from bearish to bullish. Once the double bottom is confirmed and we expect an upward momentum, we can draw the Fibonacci retracement levels from the peak between the two bottoms to the lowest point of the pattern.
Traders may enter a long position when the price breaks above the resistance level created by the peak between the two bottoms. Then, they may look for a significant Fibonacci retracement level that is likely to act as support and set the stop loss there. Take-profit points might be determined based on Fibonacci extension levels that align with previous swing highs for enhanced reliability.
The Fibonacci tool can be very useful in stock trading. When researching the best stocks for swing trading, it's essential to choose volatile yet liquid assets. Ready to try out new opportunities to swing trade stocks today? Open an FXOpen account and start exploring stock CFDs!
Swing Trading with the MACD Indicator
A swing trading strategy using the Moving Average Convergence Divergence (MACD) should bring in another technical indicator for a more robust approach to capturing significant short- to medium-term price movements.
We will use the standard MACD settings, which typically include a 12-period EMA, a 26-period EMA, and a 9-period signal line, and the Stochastic oscillator with a standard 14-period setting. This strategy is often applied on a 4-hour candlestick chart.
When the MACD line crosses above the signal line, it can be interpreted as a buy signal. If the Stochastic is below 20 (the oversold area) and starts moving upward, it confirms the buy signal. On the other hand, if the MACD line crosses below the signal line, it is considered a sell signal. If the Stochastic is above 80 (the overbought area) and starts moving downward, it confirms the sell signal.
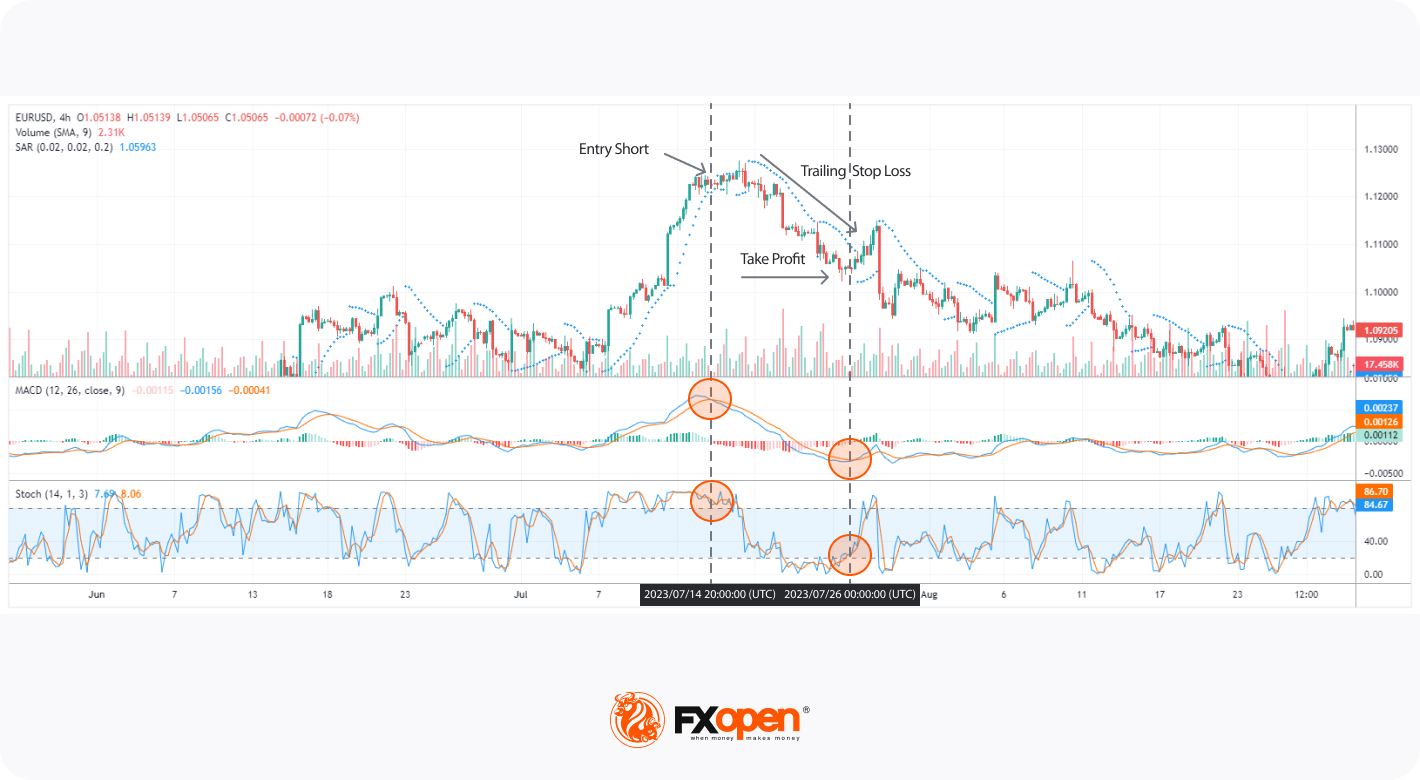
Stop-loss orders may be set just beyond recent support or resistance levels for long and short trades, respectively. Alternatively, traders can use the Parabolic SAR as a trailing stop loss. A bullish MACD crossover aligning with the Stochastic rising above 20 can be a take-profit signal for closing a short position. Respectively, the bearish MACD cross and the Stochastic falling down below 80 could provide a take-profit level for long positions.
Swing Trading a Bull Flag Breakout
In the broader meaning of swing trading, a possible breakout can also be applied to capitalise on price movements beyond established support or resistance areas. We will consider a strategy that combines the bull flag chart pattern and the Relative Strength Index with a standard 14-period setting. We apply the strategy on a 4-hour chart.
The bull flag chart pattern consists of a sharp price rise (the "flagpole") followed by a period of consolidation (the "flag"). The flag is typically a downward-sloping channel. This pattern suggests a potential continuation of an uptrend. When the price is within the flag pattern, we monitor the RSI. If the RSI is reversing up above 50, it can be interpreted as confirmation of a breakout. A surge in trading volume when the price breaks out of the flag pattern adds further validity to the trade.
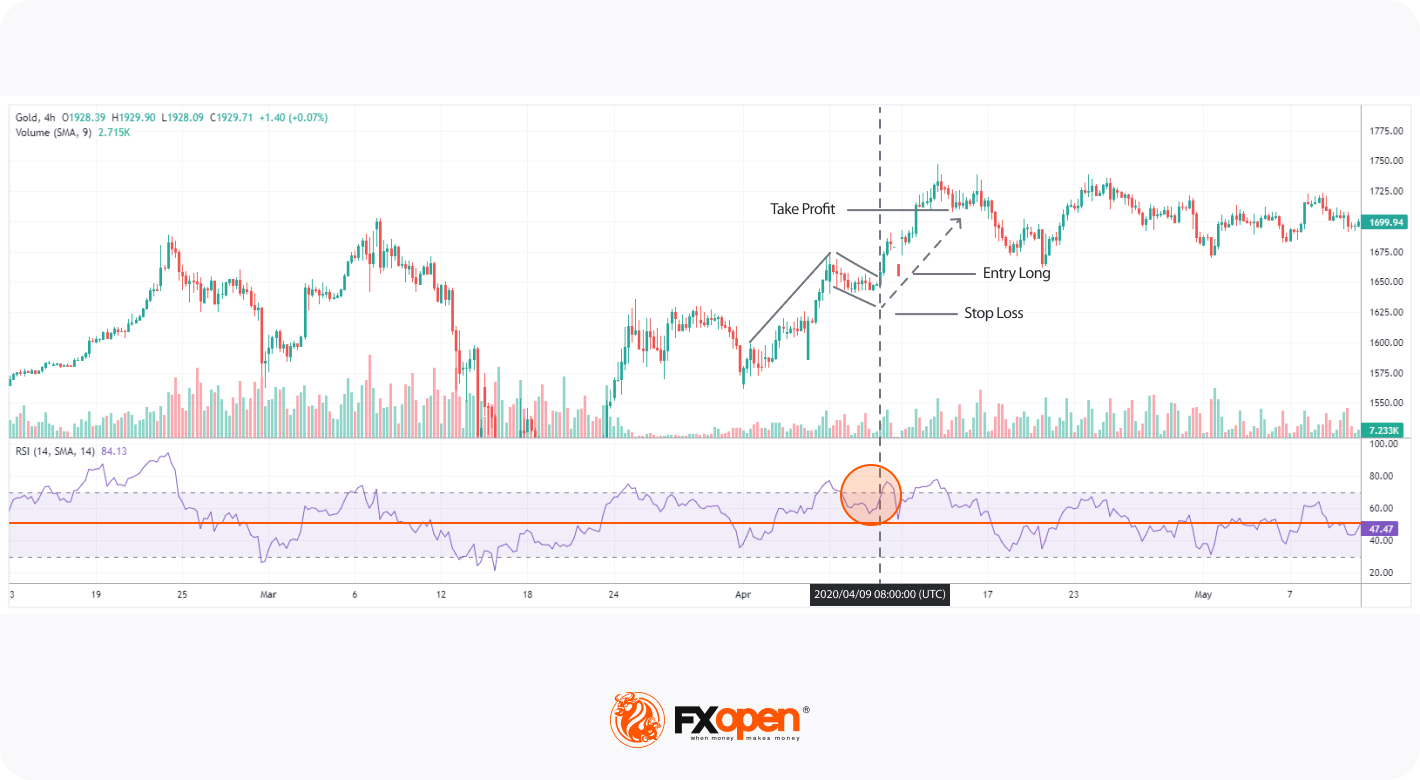
Traders typically enter a long position when the price breaks above the upper boundary of the bull flag and implement a stop-loss order just below its lower boundary. For the take-profit point, some traders measure the length of the flagpole and project it upwards or place the profit target on the closest resistance level, as seen on the chart.
Essential Swing Trading Insights
Here are some insights you may want to use in your trading plan.
- Create a clear and comprehensive trading plan that outlines your strategies, risk tolerance, and objectives. Stick to your plan and keep emotions aside.
- Only risk what you can afford to lose on a single trade.
- Keep up with financial news and developments that could impact the assets you're trading.
- Swing trading requires patience. Don't rush into trades.
- Backtest your strategies with a demo account first.
- Avoid overconfidence and set realistic goals.
Final Thoughts
In conclusion, although there are no strict swing trading rules, some popular strategies provide a versatile toolkit for capturing short- to medium-term price movements in financial markets. Whether employing technical indicators, chart patterns, or a combination of both, traders need meticulous planning, disciplined risk management, and ongoing adaptation to evolving market conditions.
This article represents the opinion of the Companies operating under the FXOpen brand only. It is not to be construed as an offer, solicitation, or recommendation with respect to products and services provided by the Companies operating under the FXOpen brand, nor is it to be considered financial advice.
Stay ahead of the market!
Subscribe now to our mailing list and receive the latest market news and insights delivered directly to your inbox.


Latest articles

Weekly Market Insights with Gary Thomson: The Week of Central Banks and Earnings
In this video, we’ll explore the key economic events and market trends, shaping the financial landscape. Get ready for insights into financial markets to help you navigate the week ahead. Let’s dive in!
In this episode of Market

Intel at a Crossroads: Earnings Beat Meets Technical Resistance
Intel has just delivered its strongest quarter in over fifteen years, and the market reaction says it all. Q2 2026 revenue surged 25% year-over-year to $16.1 billion, crushing the consensus estimate of $14.42 billion, while adjusted EPS of

Tesla: Complex Range Structure Breaks Down Following Quarterly Earnings
Tesla released its Q2 2026 results after the market closed on 22 July. Revenue increased 26% year-on-year to $28.24 billion, while vehicle deliveries reached a record 480,126 units. However, operating margin fell sharply to 1.4%, down from