


GBP/USD and AUD/USD At Risk of More Losses
FXOpen
GBP/USD started a fresh decline and broke the 1.3040 support area. AUD/USD is under pressure and it could accelerate losses below the 0.7220 support.
Important Takeaways for GBP/USD and AUD/USD
- The British Pound recovered towards 1.3175 where it faced sellers, resulting in a bearish move.
- GBP/USD broke a major bullish trend line with support at 1.3130 on the hourly chart.
- AUD/USD failed to surpass the 0.7300 resistance and declined recently.
- The pair may continue to move down towards the 0.7180 or 0.7150 support level in the near term.
GBP/USD Technical Analysis
The British recovered nicely this past week above the 1.3000 level against the US Dollar. The GBP/USD pair surpassed the 1.3100 and 1.3120 resistance levels, but it failed to break the 1.3175 resistance.
The pair formed a high at 1.3174 on FXOpen and later started a downside move. Sellers pushed the price below the 1.3150 support and the 50 hourly simple moving average. More importantly, there was a break below a major bullish trend line with support at 1.3130 on the hourly chart.
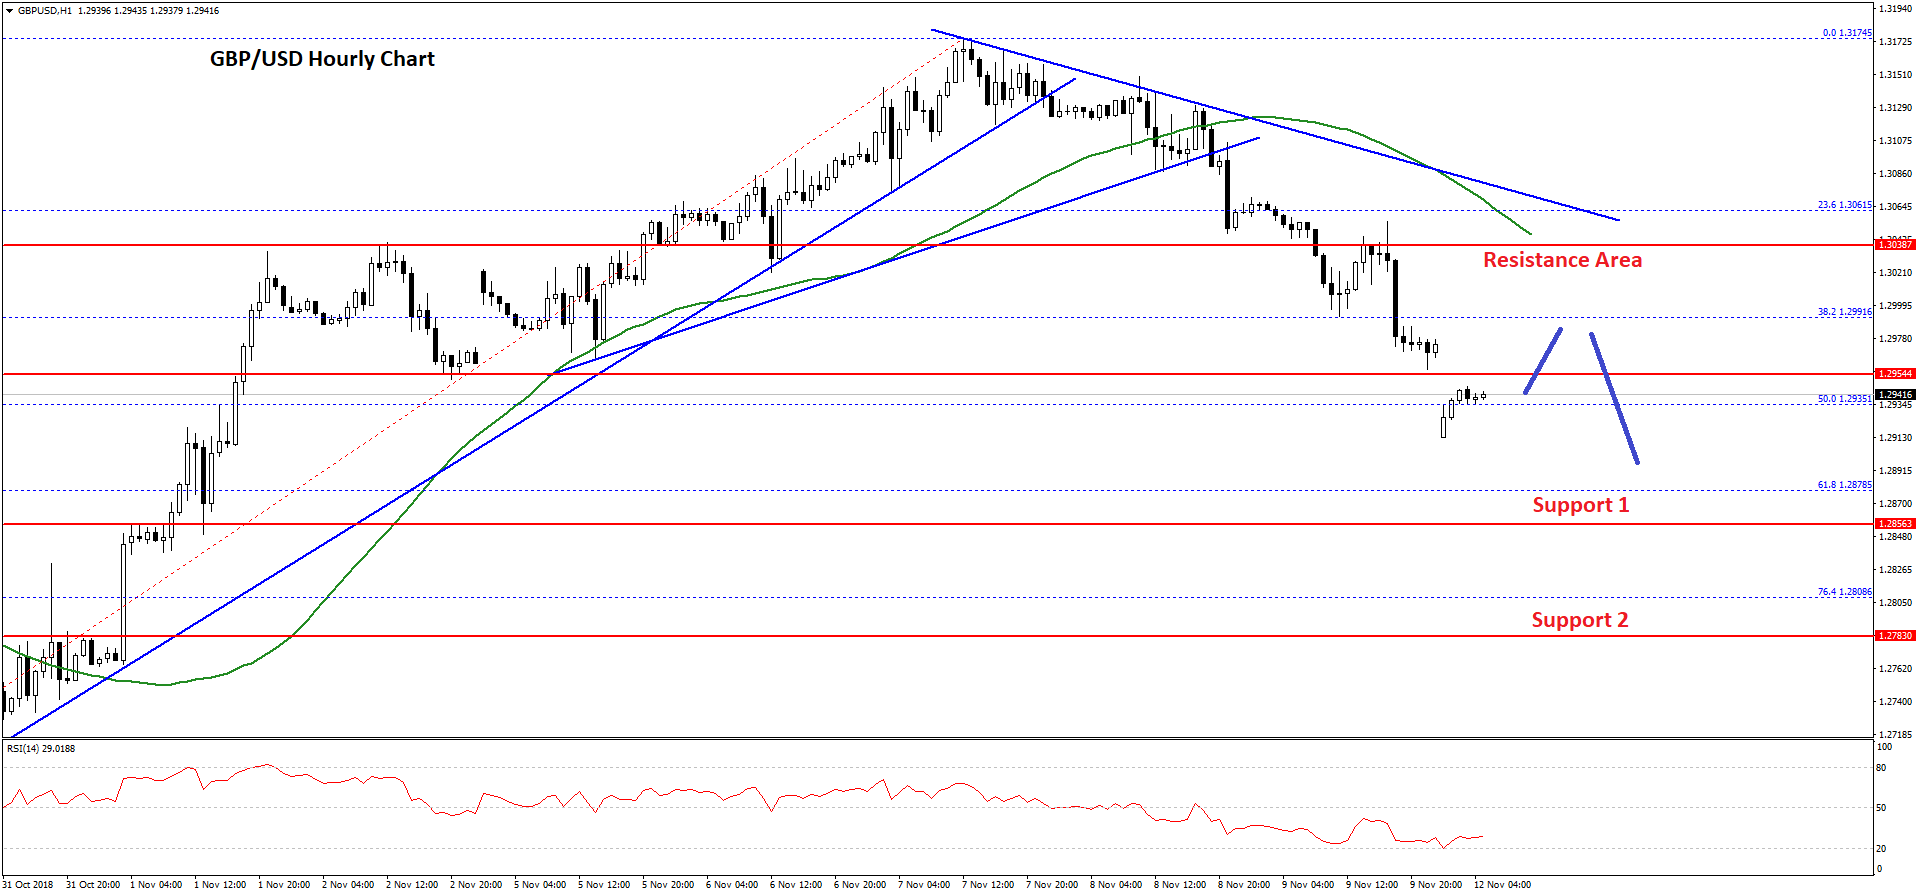
Later, there was a break below the 1.3080 support and another bullish trend line. Sellers gained control and pushed the pair below the 1.3000 handle and the 50% Fib retracement level of the last wave from the 1.2695 swing low to 1.3174 high.
At the moment, the pair is consolidating losses around the 1.2940 level with a bearish angle. It seems like the pair may continue to move down and it could trade towards the 1.2855 support.
If there are further losses below 1.2855, the pair may perhaps decline towards the 1.2780 support level. On the other hand, if there is an upside correction, the pair could find resistance near the 1.2990 and 1.3000 levels.
Moreover, there is a connecting bearish trend line in place with resistance at 1.3060 on the same chart. Finally, the 50 hourly SMA is also positioned near the 1.3060 level to prevent gains.
Therefore, recoveries towards the 1.3000 and 1.3060 levels are likely to face a solid selling interest in the near term. On the downside, sellers could target 1.2855 or 1.2780.
AUD/USD Technical Analysis
The Aussie Dollar climbed higher recently and traded above the 0.7200 resistance against the US Dollar. The AUD/USD pair even traded above the 0.7250 resistance and tested the 0.7300 handle where sellers emerged.
The pair formed a top near the 0.7300 level and later started a downside move. It declined below the 0.7280 support and the 50 hourly simple moving average.
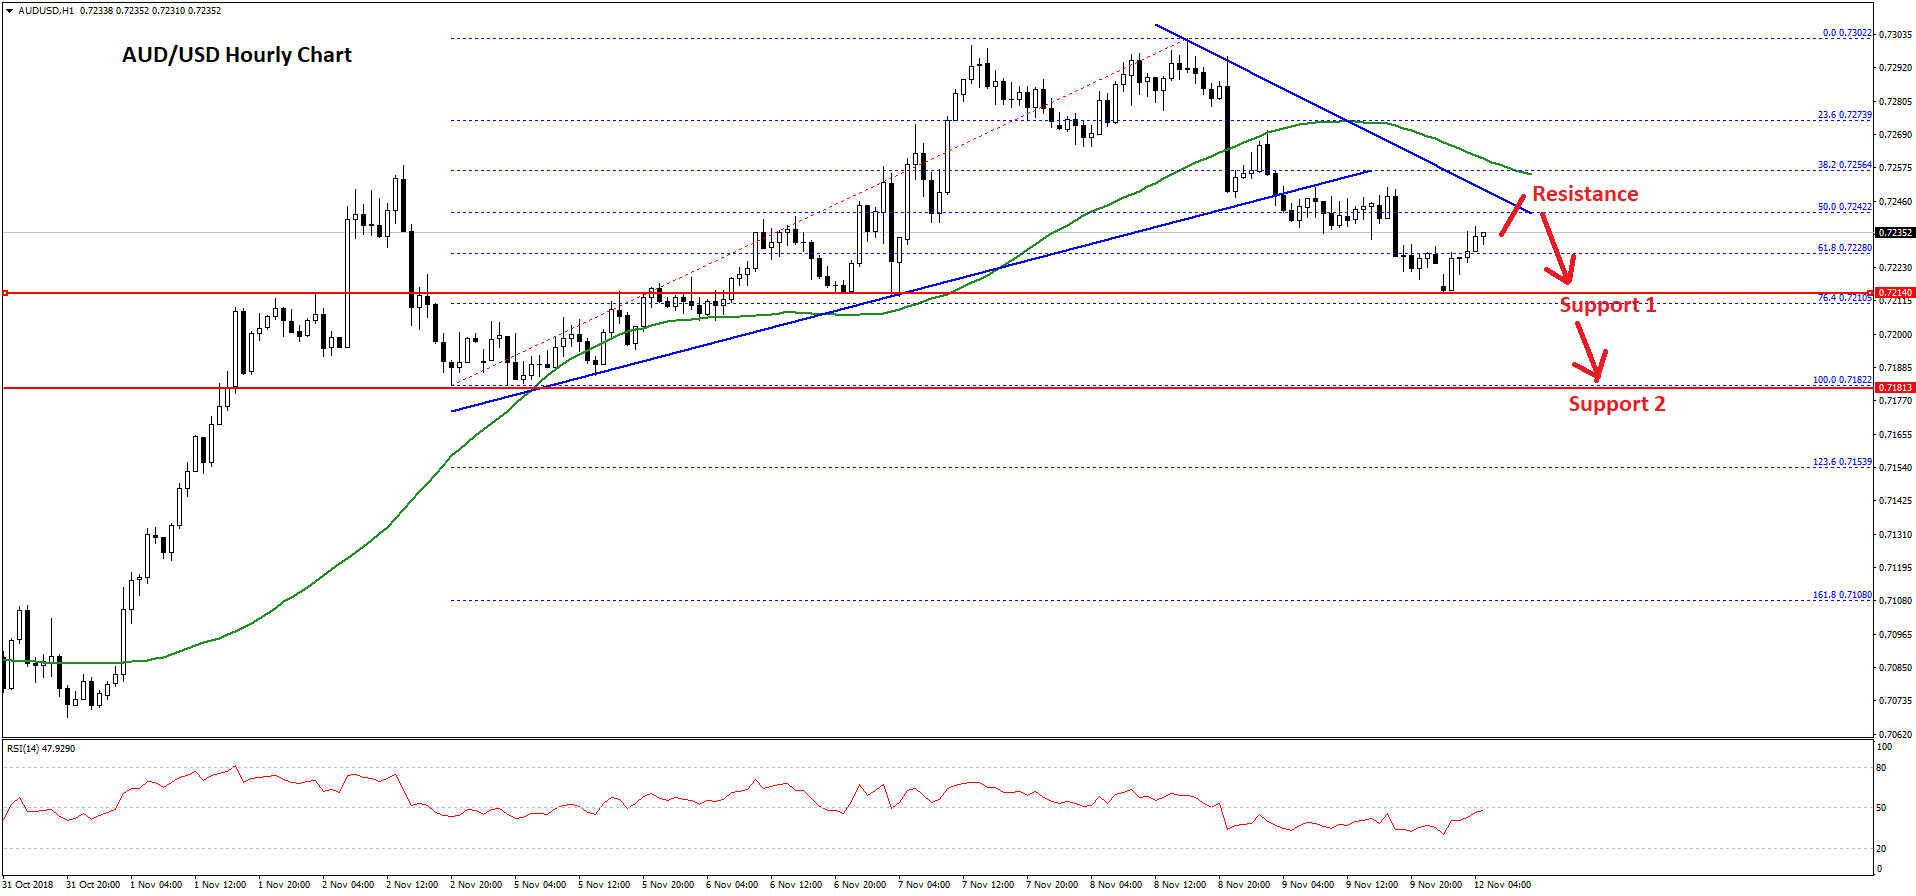
Later, there was a break below a key bullish trend line with support at 0.7250 on the hourly chart. It opened the doors for more losses and the pair traded towards the 0.7200-0.7210 support area.
Besides, there was a break below the 61.8% Fib retracement level of the last wave from the 0.7182 low to 0.7302 high. If there are further losses, the pair may decline towards the 0.7180 swing low, below which the pair will most likely revisit the 0.7150 support area.
On the flip side, if there is an upside correction, the previous support at 0.7240, a connecting bearish trend around the same area, and the 50 hourly SMA are likely to act as strong hurdles for buyers. A successful close above 0.7250 may well push AUD/USD back towards the 0.7300 swing high, which is a significant resistance.
Trade over 50 forex markets 24 hours a day with FXOpen. Take advantage of low commissions, deep liquidity, and spreads from 0.0 pips (additional fees may apply). Open your FXOpen account now or learn more about trading forex with FXOpen.
This article represents the opinion of the Companies operating under the FXOpen brand only. It is not to be construed as an offer, solicitation, or recommendation with respect to products and services provided by the Companies operating under the FXOpen brand, nor is it to be considered financial advice.
Stay ahead of the market!
Subscribe now to our mailing list and receive the latest market news and insights delivered directly to your inbox.


Latest articles

DAX 40: consolidation amid technology sell-off
A wave of selling in the technology sector that emerged earlier this week has weighed on European equities. The trigger was investor concern over the profitability of large-scale debt-funded investments by major US tech companies in AI infrastructure. The Nasdaq

Euro Hits Fresh Yearly Lows Amid Dovish ECB Signals
The euro remains under pressure following weak macroeconomic data from the euro area and fresh signals that the European Central Bank is prepared to maintain a more accommodative monetary policy stance. Data released yesterday pointed to a deterioration in business

Pound at Key Levels: Markets Assess Impact of Political Uncertainty in the UK
The British pound remains under pressure following increased political uncertainty in the United Kingdom triggered by the Prime Minister’s resignation. Investors are assessing potential shifts in the political and economic policy outlook after the head of government stepped down,