


GBP/USD and EUR/GBP: British Pound Bulls In Control
FXOpen

GBP/USD started a strong increase above the 1.3100 resistance area and climbed to 1.3200. EUR/GBP is currently correcting higher, but upsides remain capped in the near term.
Important Takeaways for GBP/USD and EUR/GBP
- The British Pound started a sharp upward move from the 1.2980 swing low.
- There is a connecting bullish trend line forming with support near 1.3135 on the hourly chart of GBP/USD.
- EUR/GBP started a short term upside correction from the 0.8386 swing low.
- There was a break above a key bearish trend line with resistance near 0.8412 on the hourly chart.
GBP/USD Technical Analysis
After forming a support base near the 1.2980 level, the British Pound started a strong rise against the US Dollar. As a result, the GBP/USD pair broke many hurdles near 1.3050 and 1.3100 to enter a positive zone.
Moreover, there was a break above the 1.3160 resistance area and the pair settled nicely above the 50 hourly simple moving average. Finally, it climbed above the 1.3200 level and traded as high as 1.3209 on FXOpen.
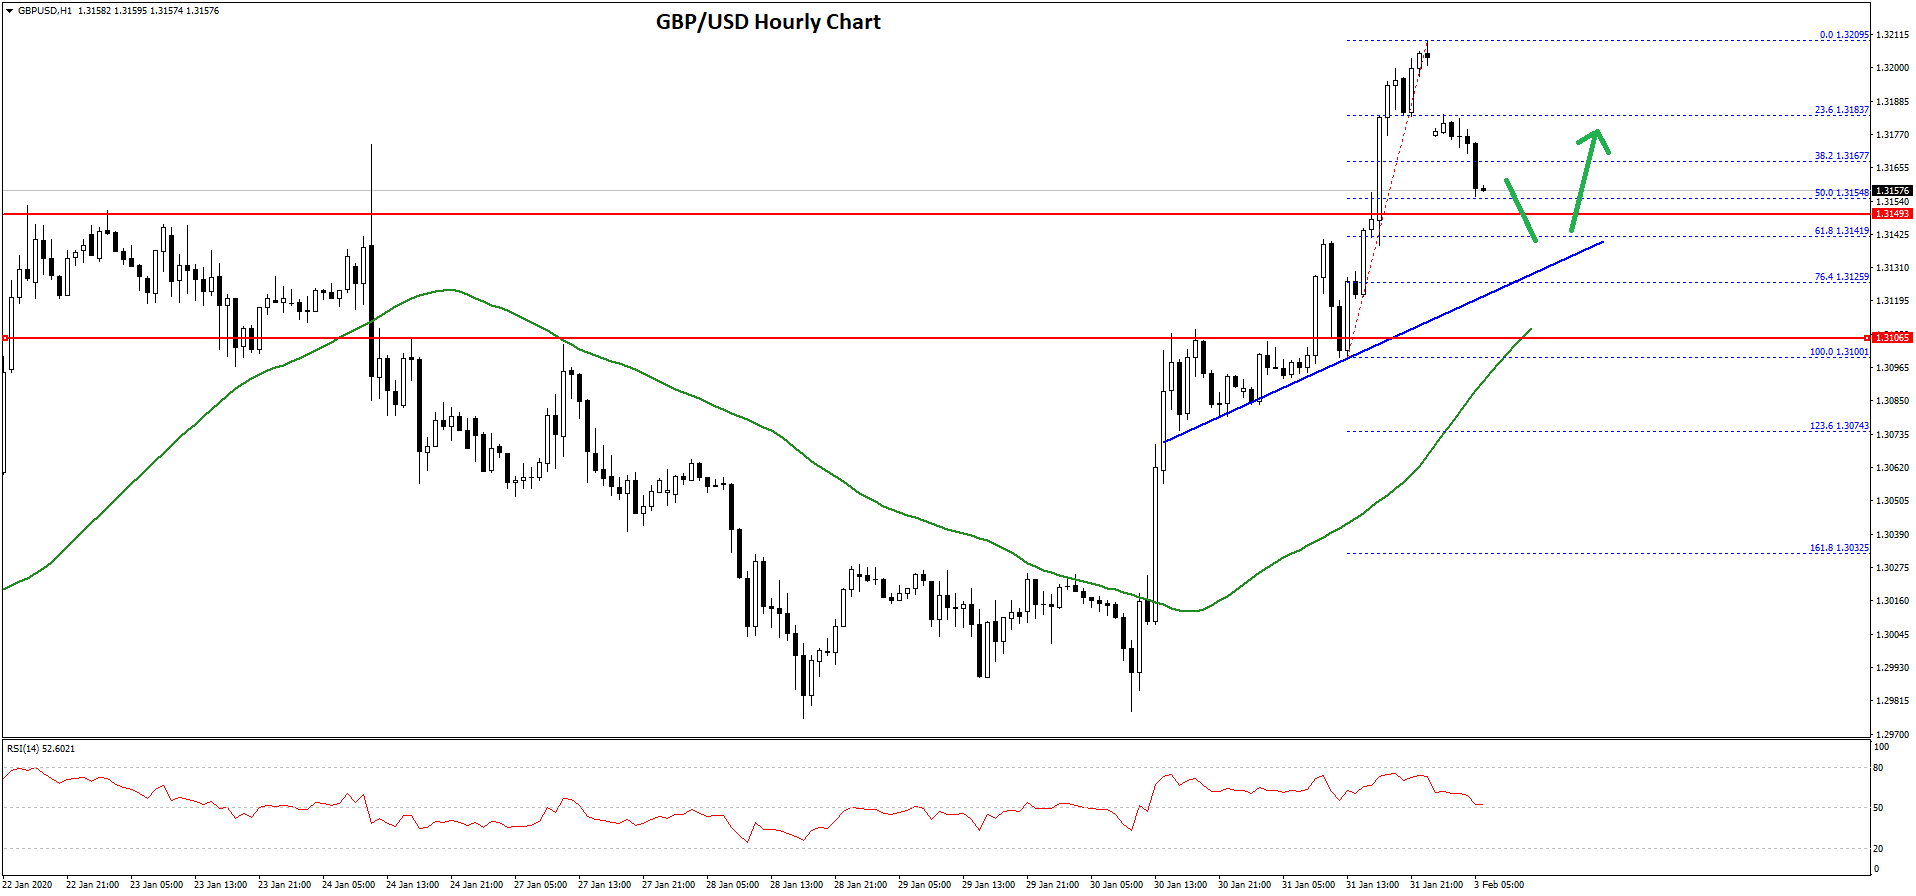
It is currently correcting lower below the 1.3200 and 1.3180 levels. There was a break below the 23.6% Fib retracement level of the upward move from the 1.3100 low to 1.3209 high.
However, the pair is now trading near the 1.3160 support area. More importantly, there is a connecting bullish trend line forming with support near 1.3135 on the hourly chart of GBP/USD.
The 50% Fib retracement level of the upward move from the 1.3100 low to 1.3209 high is also acting as a support near the 1.3154 level. Therefore, the pair remains well supported above the 1.3120 level.
If it fails to stay above 1.3120 and 1.3100, the bears are likely to take control. On the upside, there are chances of a strong rise above the 1.3180 and 1.3200 levels.
If there is a proper close above the 1.3200 resistance area, GBP/USD bulls are likely to aim another increase towards the 1.3240 and 1.3250 resistance levels.
EUR/GBP Technical Analysis
The Euro declined heavily from well above the 0.8460 level against the British Pound. The EUR/GBP pair broke the 0.8450 and 0.8420 support level to enter a bearish zone.
Moreover, it broke the 0.8400 level and traded as low as 0.8386. It is currently correcting higher above the 0.8400 resistance area. The bulls managed to push the pair above the 23.6% Fib retracement level of the recent decline from the 0.8487 high to 0.8386 low.
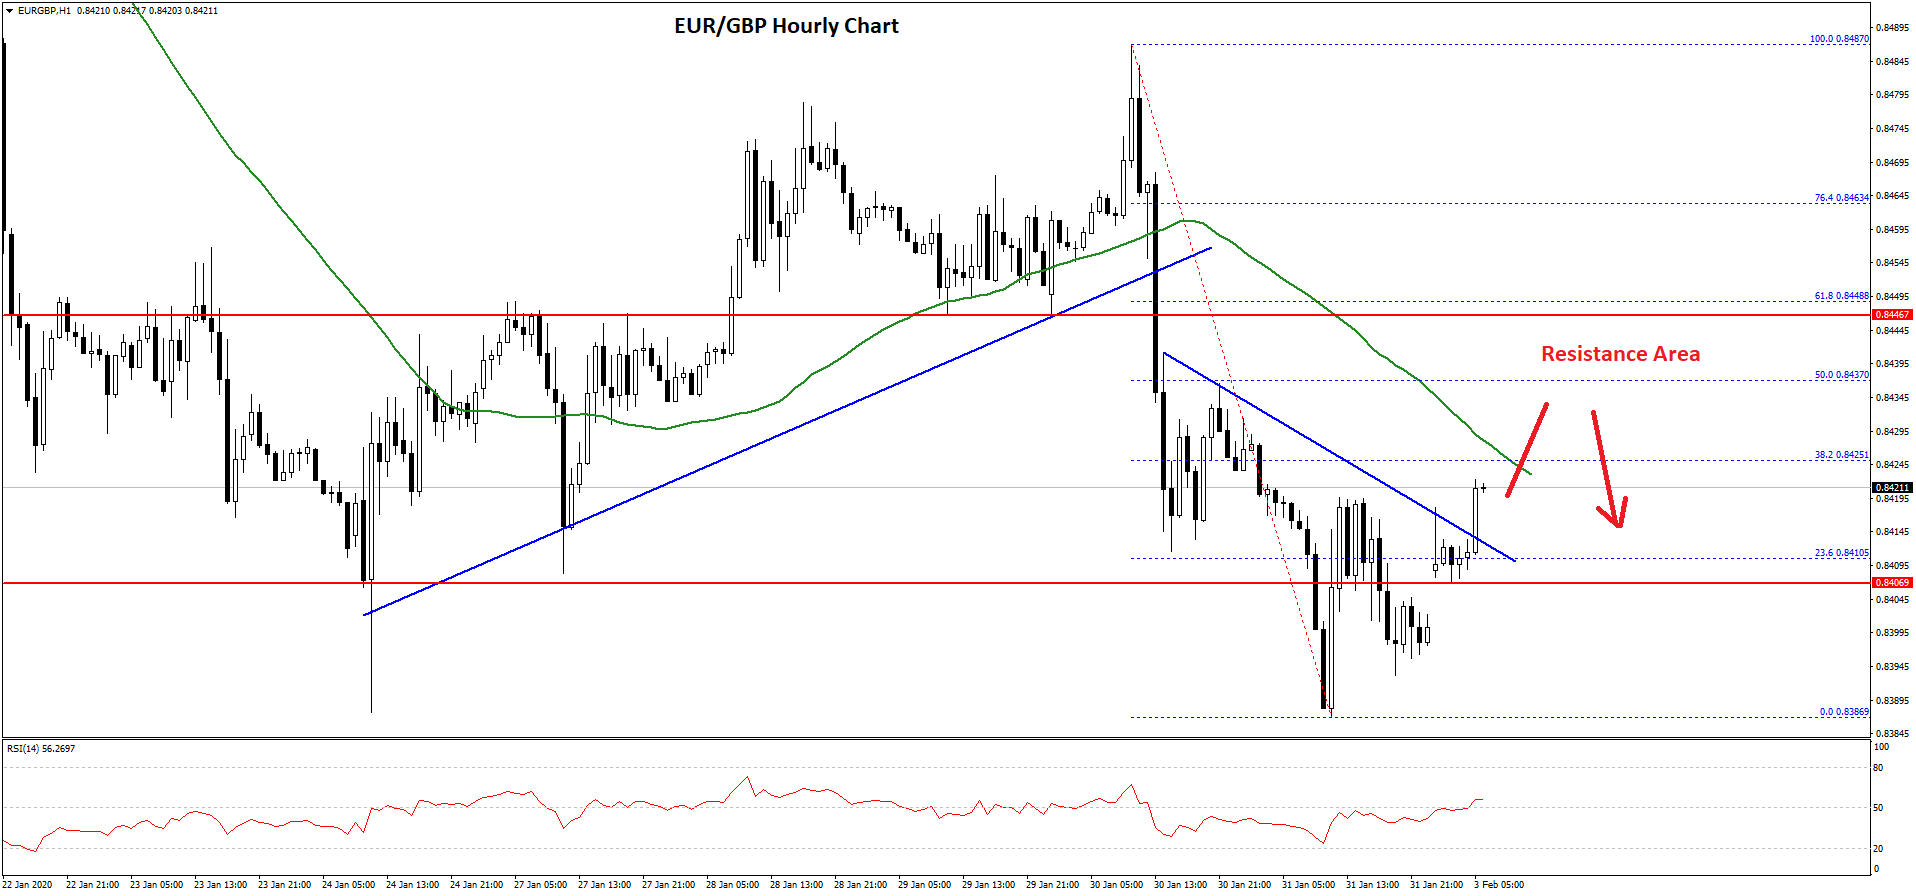
Besides, there was a break above a key bearish trend line with resistance near 0.8412 on the hourly chart. However, there are a few key hurdles near the 0.8425 and 0.8435 levels.
First, the 50 hourly simple moving average is near the 0.8425 level. Second, the 50% Fib retracement level of the recent decline from the 0.8487 high to 0.8386 low is near the 0.8435 level.
The main hurdle for more upsides is near the 0.8440 level, above which EUR/GBP might start a strong rise towards the 0.8500 level in the near term.
Conversely, GBP bulls are likely to remain in action below 0.8440. In the mentioned case, EUR/GBP may perhaps resume its decline below the 0.8400 and 0.8380 support levels in the near term.
Trade over 50 forex markets 24 hours a day with FXOpen. Take advantage of low commissions, deep liquidity, and spreads from 0.0 pips (additional fees may apply). Open your FXOpen account now or learn more about trading forex with FXOpen.
This article represents the opinion of the Companies operating under the FXOpen brand only. It is not to be construed as an offer, solicitation, or recommendation with respect to products and services provided by the Companies operating under the FXOpen brand, nor is it to be considered financial advice.
Stay ahead of the market!
Subscribe now to our mailing list and receive the latest market news and insights delivered directly to your inbox.


Latest articles

US Dollar Strengthens Amid Equity Market Weakness and Hawkish Fed Rhetoric
The US dollar continues to hold firm near multi-year highs as sentiment across equity markets deteriorates and investors increasingly expect the Federal Reserve to maintain a restrictive monetary policy stance for longer. The US economy remains resilient, while inflation risks

Bitcoin: Corrective Channel Broken as Traders Turn More Active
Bitcoin has come under the influence of several factors simultaneously. The wave of selling at the beginning of June was linked to Strategy's first disclosed Bitcoin sale in several years, a prolonged series of outflows from spot ETFs, and a

DAX 40: consolidation amid technology sell-off
A wave of selling in the technology sector that emerged earlier this week has weighed on European equities. The trigger was investor concern over the profitability of large-scale debt-funded investments by major US tech companies in AI infrastructure. The Nasdaq