


GBP/USD and EUR/GBP: British Pound Buyers Under Pressure
FXOpen
GBP/USD declined heavily after it failed to break the 1.3200 resistance area. EUR/GBP is correcting lower, but dips remain supported near the 0.8580 area.
Important Takeaways for GBP/USD and EUR/GBP
- The British Pound failed to break the 1.3200 resistance and declined heavily below 1.3120.
- There was a break below a key bullish trend line with support at 1.3065 on the hourly chart of GBP/USD.
- EUR/GBP climbed higher recently above the 0.8550 and 0.8600 resistance levels.
- There was a break above a major bearish trend line at 0.8565 on the hourly chart.
GBP/USD Technical Analysis
The British Pound made a couple of attempts to break the 1.3200 resistance area against the US Dollar, but it failed. The GBP/USD pair started a downward move and broke the 1.3120 and 1.3080 support levels.
The pair even broke the 1.3060 support and the 50 hourly simple moving average. It revisited the main 1.3000 support area, where buyers emerged. Besides, there was a break below a key bullish trend line with support at 1.3065 on the hourly chart of GBP/USD.
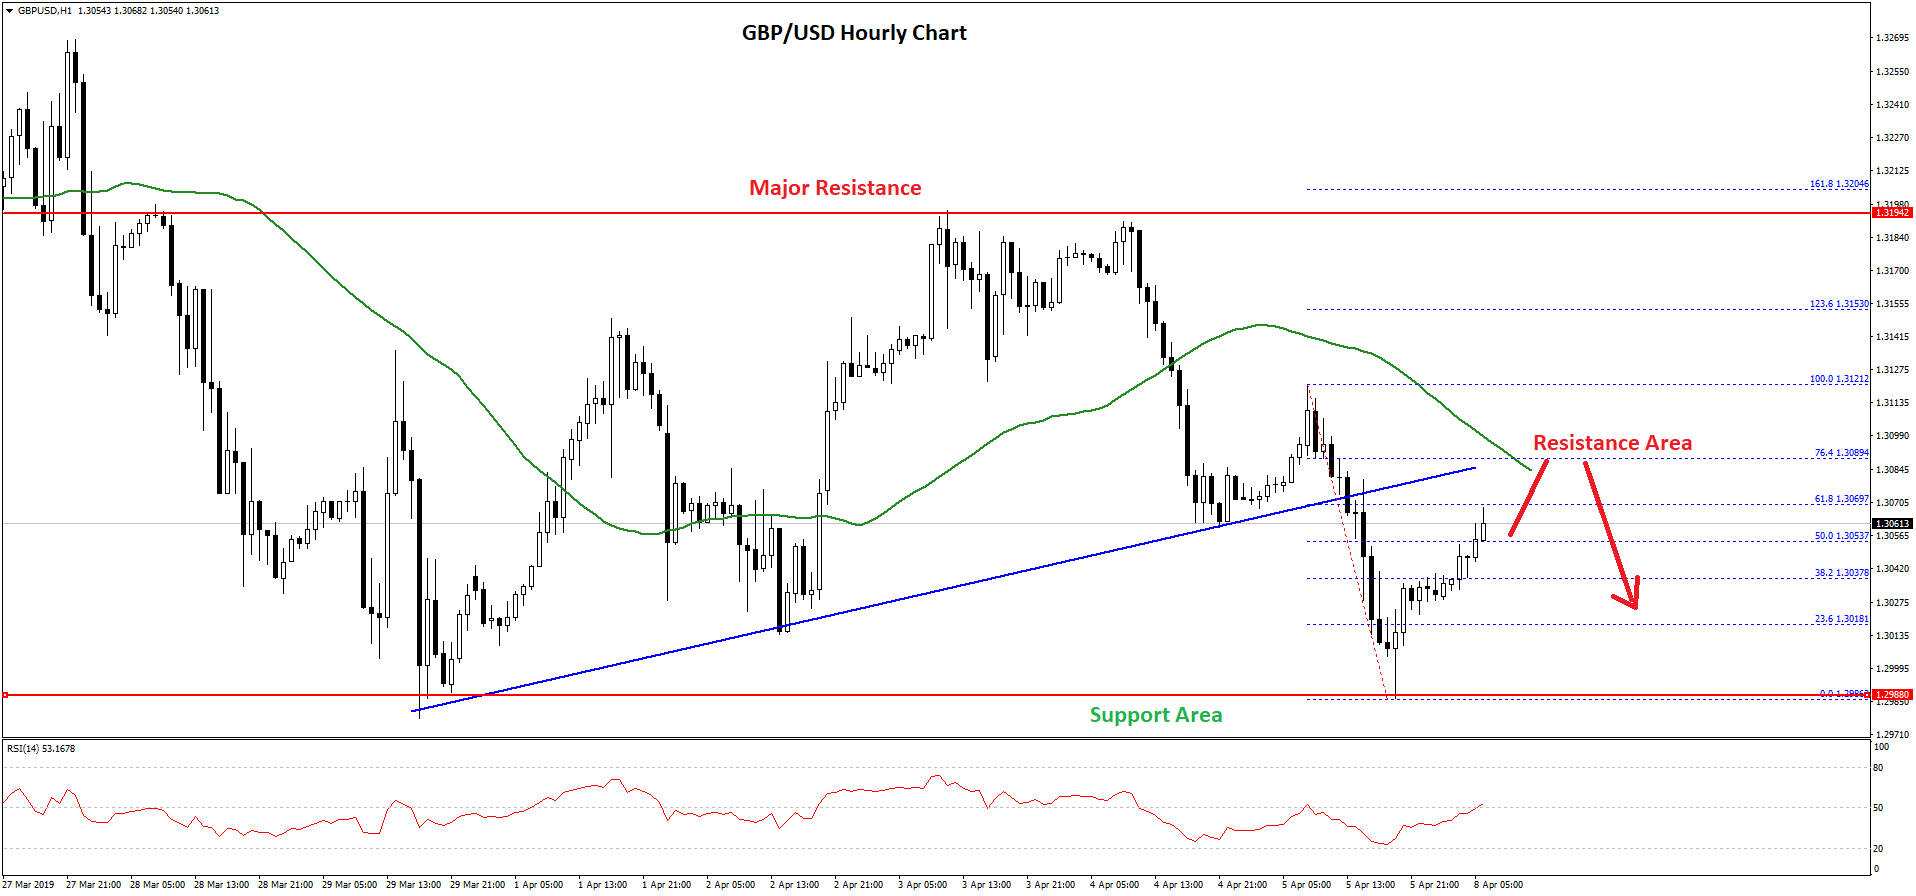
A swing low was formed at 1.2985 on FXOpen before the pair started a decent upside correction. It climbed above the 1.3020 and 1.3050 resistance levels.
There was also a break above the 50% fib retracement level of the recent decline from the 1.3121 high to 1.2985 low. However, the pair is now approaching a crucial resistance area near the 1.3080 level and the 50 hourly SMA.
Besides, the 76.4% fib retracement level of the recent decline from the 1.3121 high to 1.2985 low is also near the 1.3090 level to act as strong resistance. Therefore, a break above the 1.3080 and 1.3090 resistance levels is must for buyers to gain control in the near term.
If there is now upside break above the 1.3080 or 1.3090, the pair is likely to start a fresh decline towards the 1.3040 or 1.3020 support levels.
EUR/GBP Technical Analysis
The Euro formed a strong support base near the 0.8500-0.8510 zone against the British Pound. The EUR/GBP pair started a fresh increase and moved above the 0.8550 and 0.8600 resistance levels.
The pair even settled above the 0.8560 level and the 50 hourly simple moving average. Moreover, there was a break above a major bearish trend line at 0.8565 on the hourly chart.

Buyers pushed the price above the 0.8620 level and a swing high was formed near 0.8636 before the pair started a downside correction. The pair recently corrected below the 0.8620 level and the 50% fib retracement level of the last wave from the 0.8557 low to 0.8636 high.
However, the pair is now approaching a solid support above the 0.8580 level. The 61.8% fib retracement level of the last wave from the 0.8557 low to 0.8636 high is also near the 0.8585 zone.
Therefore, dips towards the 0.8580 level and the 50 hourly SMA are likely to find a strong buying interest in the near term. Below 0.8580, the next key support is near the 0.8550 level.
On the upside, EUR/GBP could face resistance near the 0.8615 level, above which the pair is likely to revisit the 0.8635 level in the near term. The next major hurdle above 0.8635 is at 0.8650.
Trade over 50 forex markets 24 hours a day with FXOpen. Take advantage of low commissions, deep liquidity, and spreads from 0.0 pips (additional fees may apply). Open your FXOpen account now or learn more about trading forex with FXOpen.
This article represents the opinion of the Companies operating under the FXOpen brand only. It is not to be construed as an offer, solicitation, or recommendation with respect to products and services provided by the Companies operating under the FXOpen brand, nor is it to be considered financial advice.
Stay ahead of the market!
Subscribe now to our mailing list and receive the latest market news and insights delivered directly to your inbox.


Latest articles

Weekly Market Insights with Gary Thomson: The Week of Central Banks and Earnings
In this video, we’ll explore the key economic events and market trends, shaping the financial landscape. Get ready for insights into financial markets to help you navigate the week ahead. Let’s dive in!
In this episode of Market

Intel at a Crossroads: Earnings Beat Meets Technical Resistance
Intel has just delivered its strongest quarter in over fifteen years, and the market reaction says it all. Q2 2026 revenue surged 25% year-over-year to $16.1 billion, crushing the consensus estimate of $14.42 billion, while adjusted EPS of

Tesla: Complex Range Structure Breaks Down Following Quarterly Earnings
Tesla released its Q2 2026 results after the market closed on 22 July. Revenue increased 26% year-on-year to $28.24 billion, while vehicle deliveries reached a record 480,126 units. However, operating margin fell sharply to 1.4%, down from