


GBP/USD and EUR/GBP: British Pound Correcting Gains
FXOpen

GBP/USD is currently correcting gains from the 1.2475 resistance area. Similarly, EUR/GBP is correcting higher and it could recover towards the 0.8950 level.
Important Takeaways for GBP/USD and EUR/GBP
- The British Pound traded close to the 1.2500 resistance area, where the bears emerged.
- There was a break below a key bullish trend line with support near 1.2370 on the hourly chart of GBP/USD.
- EUR/GBP is currently correcting higher and it is trading above the 0.8800 resistance.
- There is a major bearish trend line forming with resistance near 0.8850 on the hourly chart.
GBP/USD Technical Analysis
This past week, the British Pound started a decent upward move wave above the 1.2250 resistance against the US Dollar. The GBP/USD pair even broke the 1.2350 resistance to move into a positive zone.
Finally, there was a break above the 1.2420 resistance and the pair settled above the 50 hourly simple moving average. The pair traded towards the 1.2500 level, but it failed to continue higher.
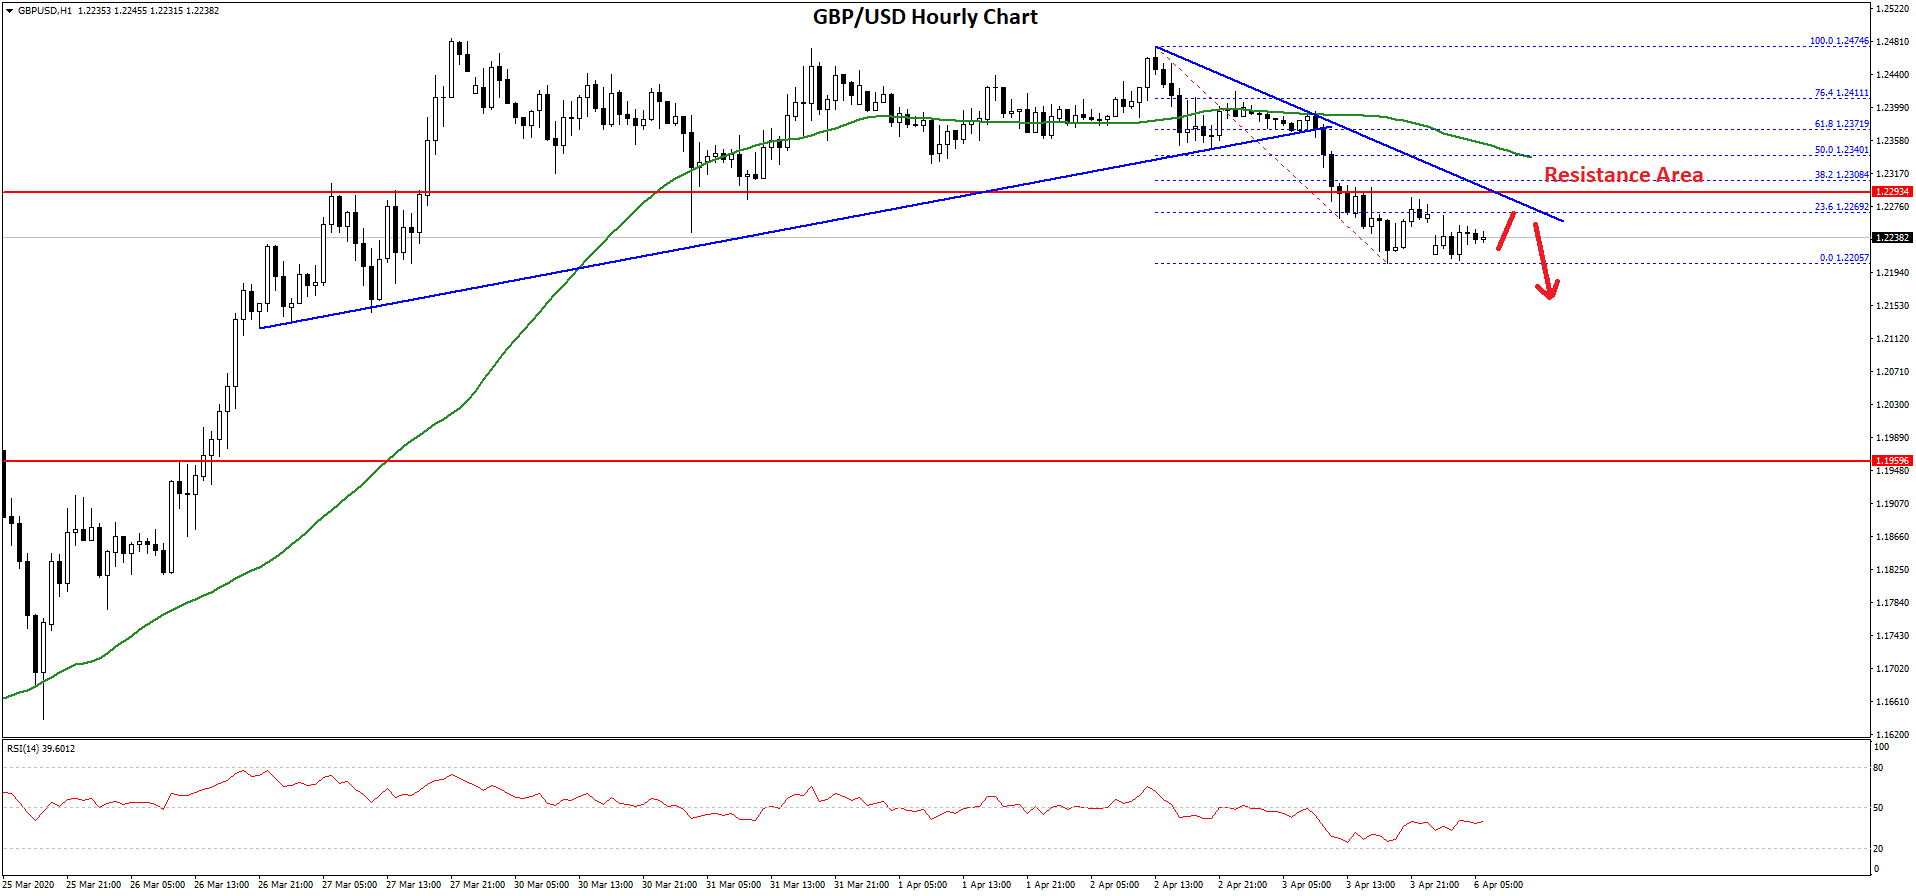
A swing high is formed near the 1.2474 on FXOpen and the pair is currently correcting lower. Recently, there was a break below a key bullish trend line with support near 1.2370 on the hourly chart of GBP/USD.
The pair broke the 1.2300 support area and traded as low as 1.2205. It is currently consolidating losses, with an immediate resistance near the 1.2265 level.
The 23.6% Fib retracement level of the recent decline from the 1.2474 high to 1.2205 low is also near the 1.2269 level. Besides, the previous support near the 1.2280 level is likely to act as a major resistance along with a bearish trend line on the same chart.
The next major resistance is near the 1.2340 level and the 50 hourly simple moving average. The 50% Fib retracement level of the recent decline from the 1.2474 high to 1.2205 low is also near 1.2340.
On the downside, the main support is near the 1.2200 area, below which GBP/USD is likely to extend its decline towards the 1.2000 support area in the near term.
EUR/GBP Technical Analysis
The Euro remained in a bearish zone and settled below the 0.9000 pivot level against the British Pound. The EUR/GBP pair even broke the 0.8800 support level to move into a bearish zone.
Besides, there was a clear break below the 0.8780 support level and the 50 hourly simple moving average. The pair traded as low as 0.8729 and it is currently correcting losses.
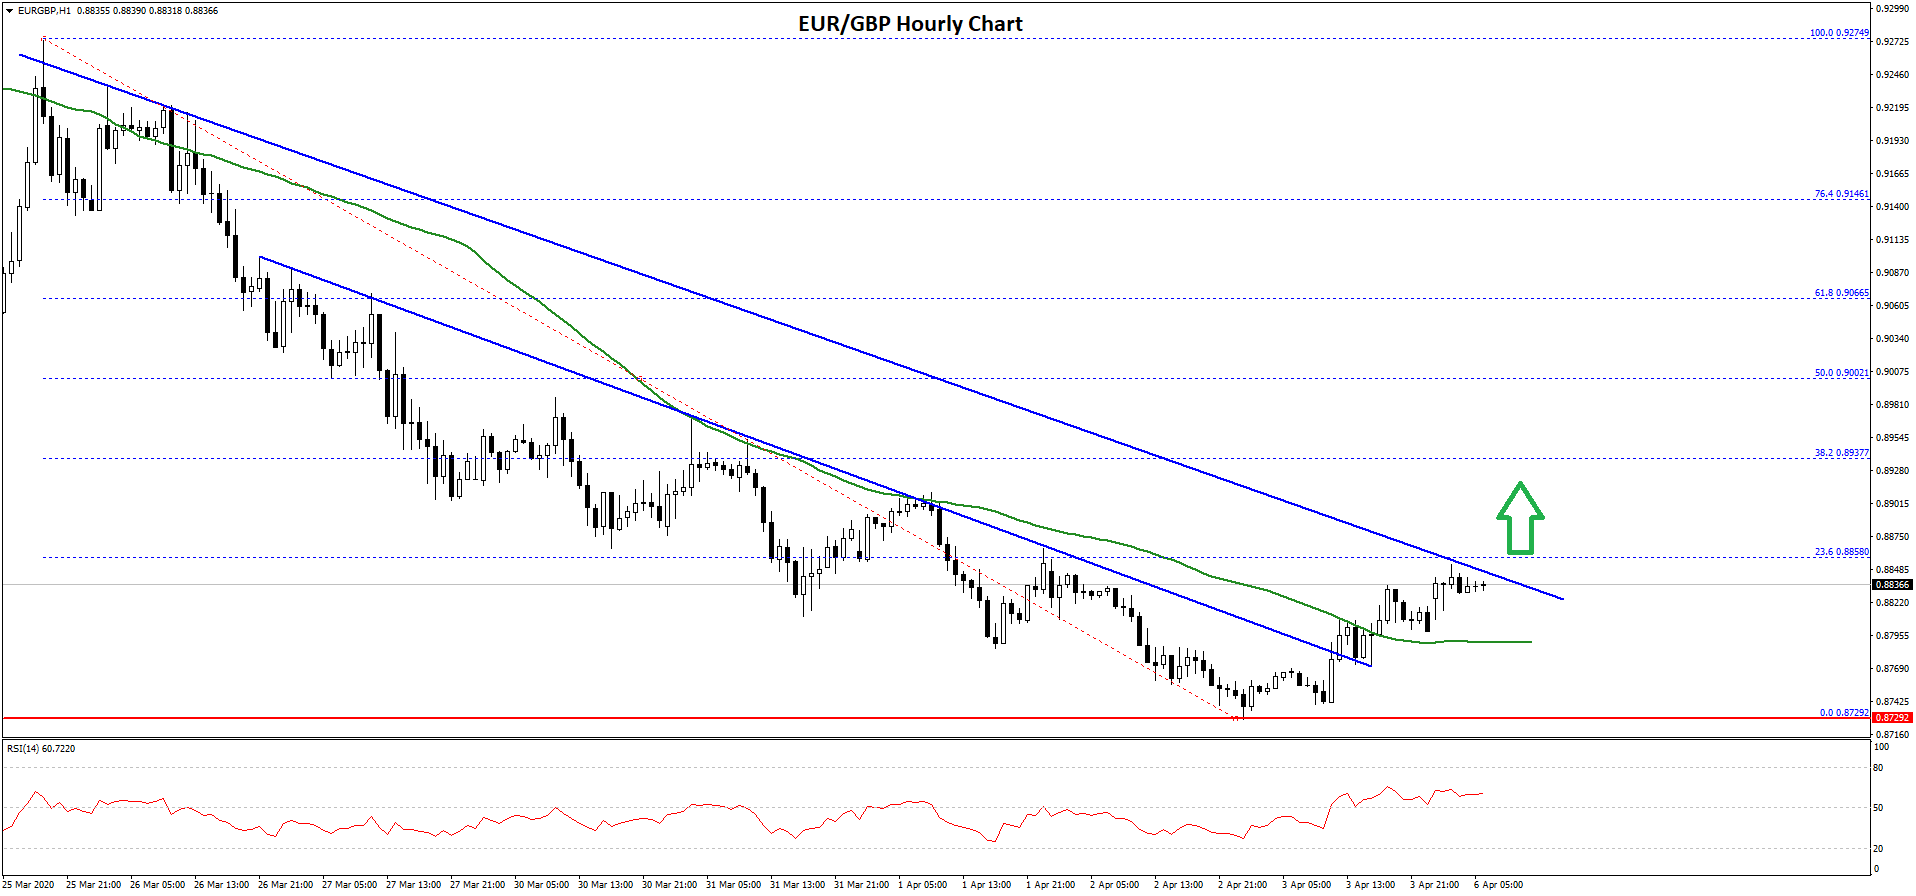
It broke the 0.8800 resistance level and the 50 hourly simple moving average. Moreover, there was a break above a connecting bearish trend line with resistance near 0.8770 on the hourly chart.
The pair is now testing the 23.6% Fib retracement level of the main decline from the 0.9274 high to 0.8729 low. There is also another major bearish trend line forming with resistance near 0.8850 on the same chart.
If EUR/GPB breaks the trend line resistance, it could continue to rise towards 0.8900. The next major resistance is near the 0.9000 or the 50% Fib retracement level of the main decline from the 0.9274 high to 0.8729 low.
If the pair fails to correct above 0.8850 or 0.8900, it could resume its decline. An initial support is near the 0.8800 level, below which the pair could dive towards 0.8700.
Trade over 50 forex markets 24 hours a day with FXOpen. Take advantage of low commissions, deep liquidity, and spreads from 0.0 pips (additional fees may apply). Open your FXOpen account now or learn more about trading forex with FXOpen.
This article represents the opinion of the Companies operating under the FXOpen brand only. It is not to be construed as an offer, solicitation, or recommendation with respect to products and services provided by the Companies operating under the FXOpen brand, nor is it to be considered financial advice.
Stay ahead of the market!
Subscribe now to our mailing list and receive the latest market news and insights delivered directly to your inbox.


Latest articles

EUR/USD and GBP/USD consolidate ahead of the Fed decision
European currencies are showing subdued dynamics, entering a consolidation phase following their previous advance. Earlier, EUR/USD and GBP/USD broke out of their ranges and strengthened; however, the subsequent correction has led both pairs to retest the previously breached

Meta: V-Shaped Recovery Meets Heavy Volume Resistance
The movement in Meta Platforms shares is being driven by two competing narratives. On one hand, advertising revenue is benefiting from AI-based tools: the Advantage+ platform continues to support strong advertiser demand, and the analyst consensus for Q1 2026 revenue

Commodity Currencies Test Key Levels Ahead of Major Macro Data
Commodity-linked currencies are trading near key levels, showing restrained price action as market participants adopt a wait-and-see approach. The fundamental backdrop is shaped by expectations surrounding the release of Australia’s inflation data and the Bank of Canada’s interest