


GBP/USD and EUR/GBP: British Pound Could Continue To Struggle
FXOpen
GBP/USD started a major decline and broke the 1.2180 support zone. As a result, EUR/GBP gained traction and rallied above the 0.8850 resistance area.
Important Takeaways for GBP/USD and EUR/GBP
- The British Pound started a significant downtrend from well above 1.2400.
- There is a crucial bearish trend line forming with resistance near 1.2180 on the hourly chart of GBP/USD.
- EUR/GBP surged above the 0.8850 and 0.8900 resistance levels.
- There is a key bullish trend line forming with support near 0.8880 on the hourly chart.
GBP/USD Technical Analysis
This past week, the British Pound struggled to clear the 1.2480 and 1.2500 resistance levels against the US Dollar. As a result, the GBP/USD pair started a major decline and broke many supports near 1.2300.
The pair even broke the 1.2200 support zone and settled well below the 50 hourly simple moving average. The decline was such that the pair broke the 1.2120 support and traded as low as 1.2076 on FXOpen.
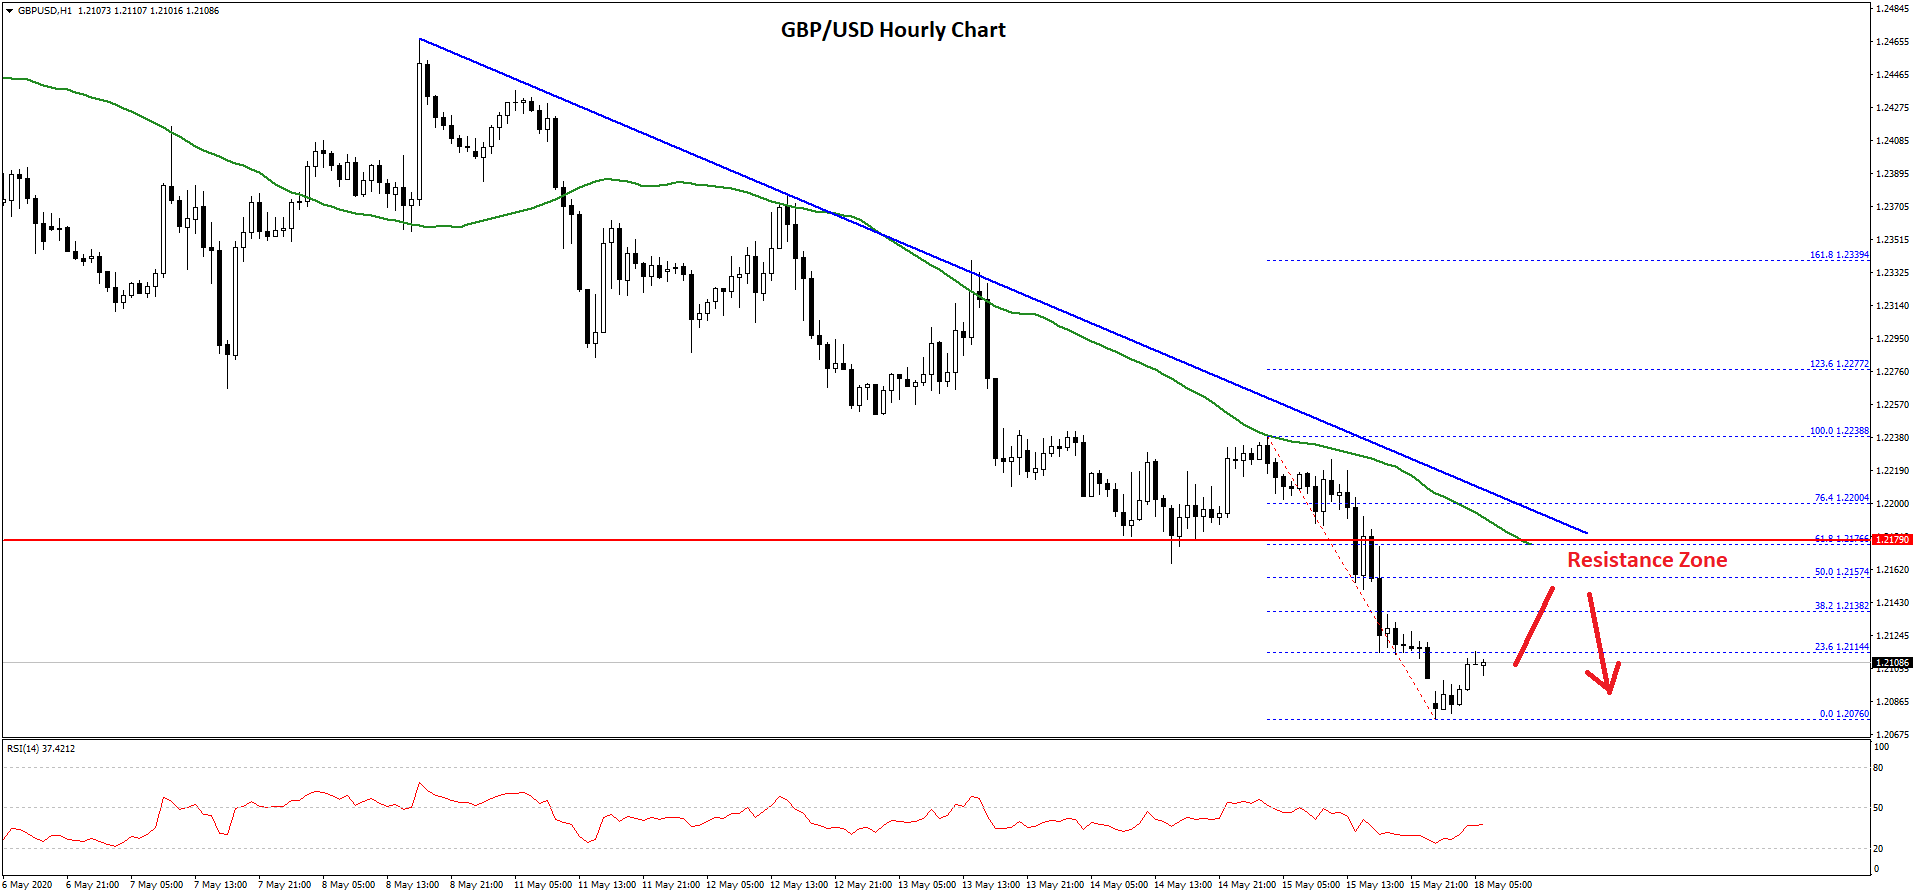
It is currently correcting higher from the 1.2076 low. An initial resistance is near the 1.2120 level or the 23.6% Fib retracement level of the recent decline from the 1.2238 high to 1.2076 low.
On the upside, the first key resistance is near the 1.2150 level. It is close to the 50% Fib retracement level of the recent decline from the 1.2238 high to 1.2076 low. There is also a crucial bearish trend line forming with resistance near 1.2180 on the hourly chart of GBP/USD.
The trend line resistance is near the previous breakdown zone and the 50 hourly simple moving average. Therefore, a successful close above the 1.2180 and 1.2200 resistance levels won’t be easy in the coming sessions.
If there is a successful close above 1.2200, the pair could start a strong recovery towards the 1.2320 and 1.2350 levels. Conversely, the pair might remain in a bearish zone below 1.2180.
On the downside, an initial support is near the 1.2080 zone, below which the bears are likely to aim a test of the 1.2000 support zone.
EUR/GBP Technical Analysis
The Euro started a strong increase from the 0.8720 support zone against the British Pound. The EUR/GBP pair clear the key 0.8800 resistance zone to enter a bullish zone.
The most important break was above the 0.8850 resistance and the 50 hourly simple moving average. The pair even climbed above the 0.8900 resistance and traded as high as 0.8958.
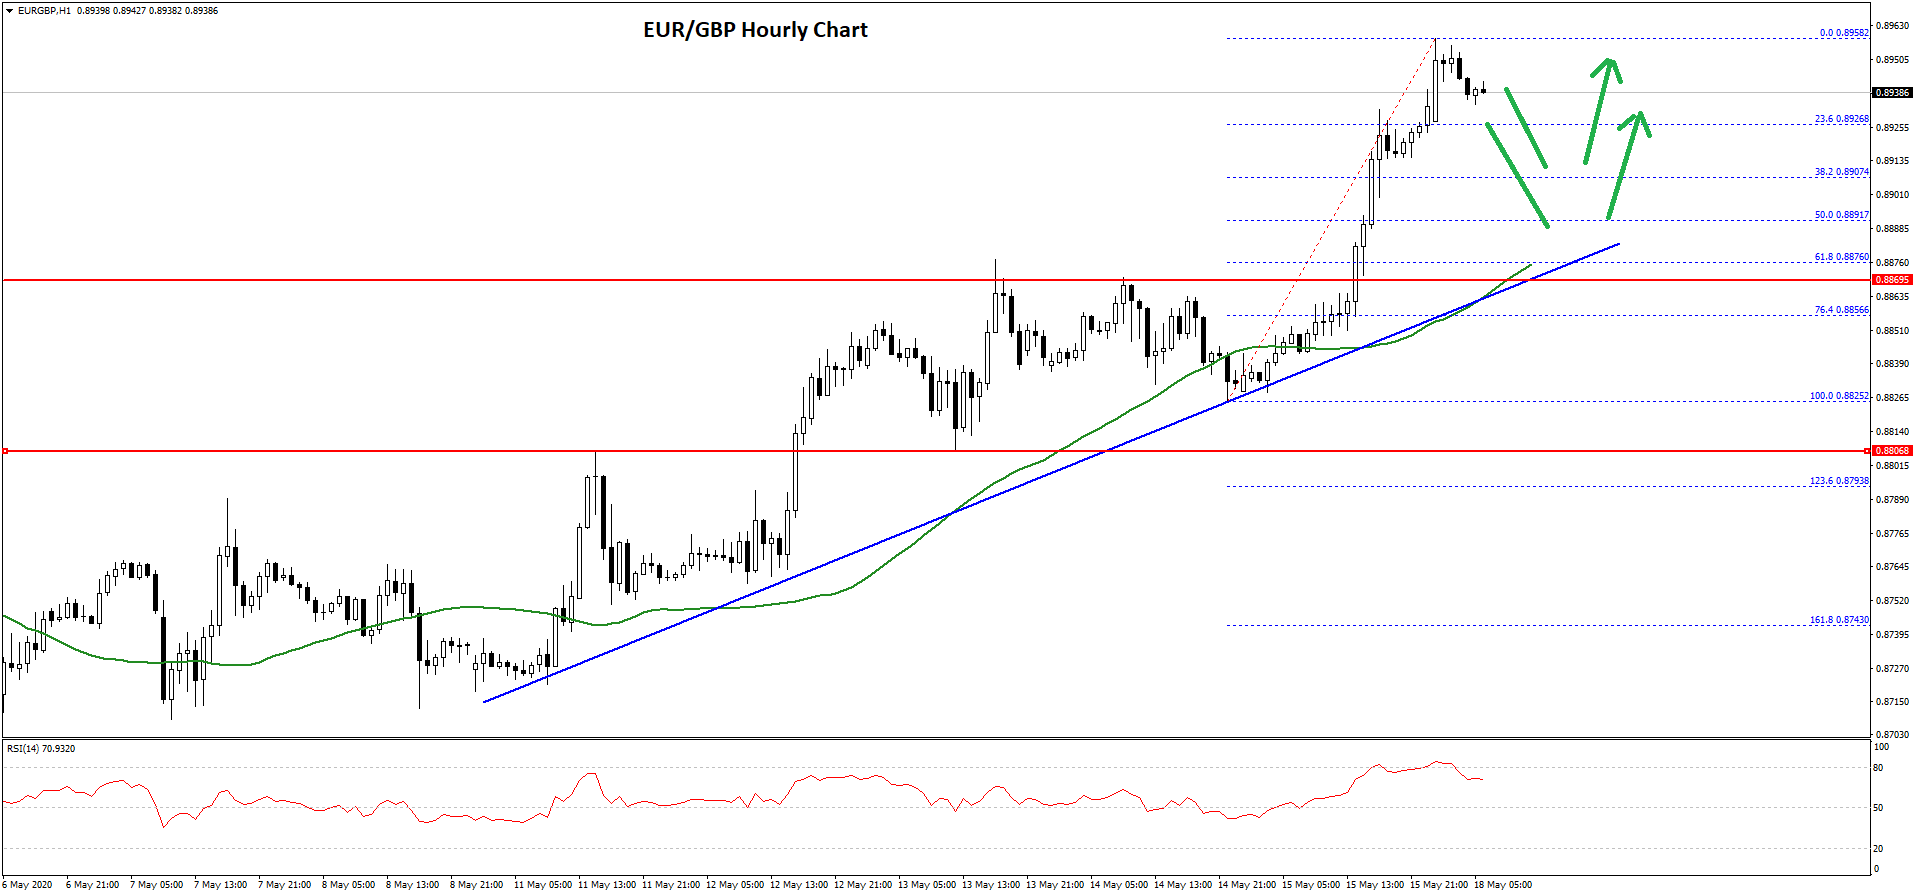
It is currently correcting lower and trading below 0.8940. An initial support is near the 0.8925 level. It is close to the 23.6% Fib retracement level of the recent rise from the 0.8825 low to 0.8958 high.
The first major support is near the 0.8900 and 0.8880 levels. There is also a key bullish trend line forming with support near 0.8880 on the hourly chart. The trend line is close to the 50% Fib retracement level of the recent rise from the 0.8825 low to 0.8958 high.
The 50 hourly simple moving average is also near the trend line support and 0.8890. Therefore, dips towards the 0.8900 support zone could find a strong buying interest in the near term.
On the upside, EUR/GBP is facing hurdles near the 0.8960 zone, above which the pair may possibly test the main 0.9000 resistance zone.
Trade over 50 forex markets 24 hours a day with FXOpen. Take advantage of low commissions, deep liquidity, and spreads from 0.0 pips (additional fees may apply). Open your FXOpen account now or learn more about trading forex with FXOpen.
This article represents the opinion of the Companies operating under the FXOpen brand only. It is not to be construed as an offer, solicitation, or recommendation with respect to products and services provided by the Companies operating under the FXOpen brand, nor is it to be considered financial advice.
Stay ahead of the market!
Subscribe now to our mailing list and receive the latest market news and insights delivered directly to your inbox.


Latest articles

Weekly Market Insights with Gary Thomson: The Week of Central Banks and Earnings
In this video, we’ll explore the key economic events and market trends, shaping the financial landscape. Get ready for insights into financial markets to help you navigate the week ahead. Let’s dive in!
In this episode of Market

Intel at a Crossroads: Earnings Beat Meets Technical Resistance
Intel has just delivered its strongest quarter in over fifteen years, and the market reaction says it all. Q2 2026 revenue surged 25% year-over-year to $16.1 billion, crushing the consensus estimate of $14.42 billion, while adjusted EPS of

Tesla: Complex Range Structure Breaks Down Following Quarterly Earnings
Tesla released its Q2 2026 results after the market closed on 22 July. Revenue increased 26% year-on-year to $28.24 billion, while vehicle deliveries reached a record 480,126 units. However, operating margin fell sharply to 1.4%, down from