


GBP/USD and EUR/GBP: British Pound Could Rise Further
FXOpen

GBP/USD started a strong increase above the 1.2300 resistance zone and it could rise further. EUR/GBP is likely to dip further before it attempts a fresh upward move.
Important Takeaways for GBP/USD and EUR/GBP
- The British Pound gained traction and rallied above the 1.2350 level.
- There is a key bullish trend line forming with support near 1.2350 on the hourly chart of GBP/USD.
- EUR/GBP surged higher above 0.9000 before it faced sellers near the 0.9050 level.
- There was a break below a major bullish trend line with support near 0.8985 on the hourly chart.
GBP/USD Technical Analysis
In the past few days, there was a decent increase in the British Pound from the 1.2220 support against the US Dollar. As a result, the GBP/USD pair climbed higher and broke many hurdles near the 1.2300 zone.
The pair even settled above the 1.2350 level and the 50 hourly simple moving average. Finally, the pair spiked above the 1.2400 zone and a new intraday high is formed near the 1.2419 level on FXOpen.
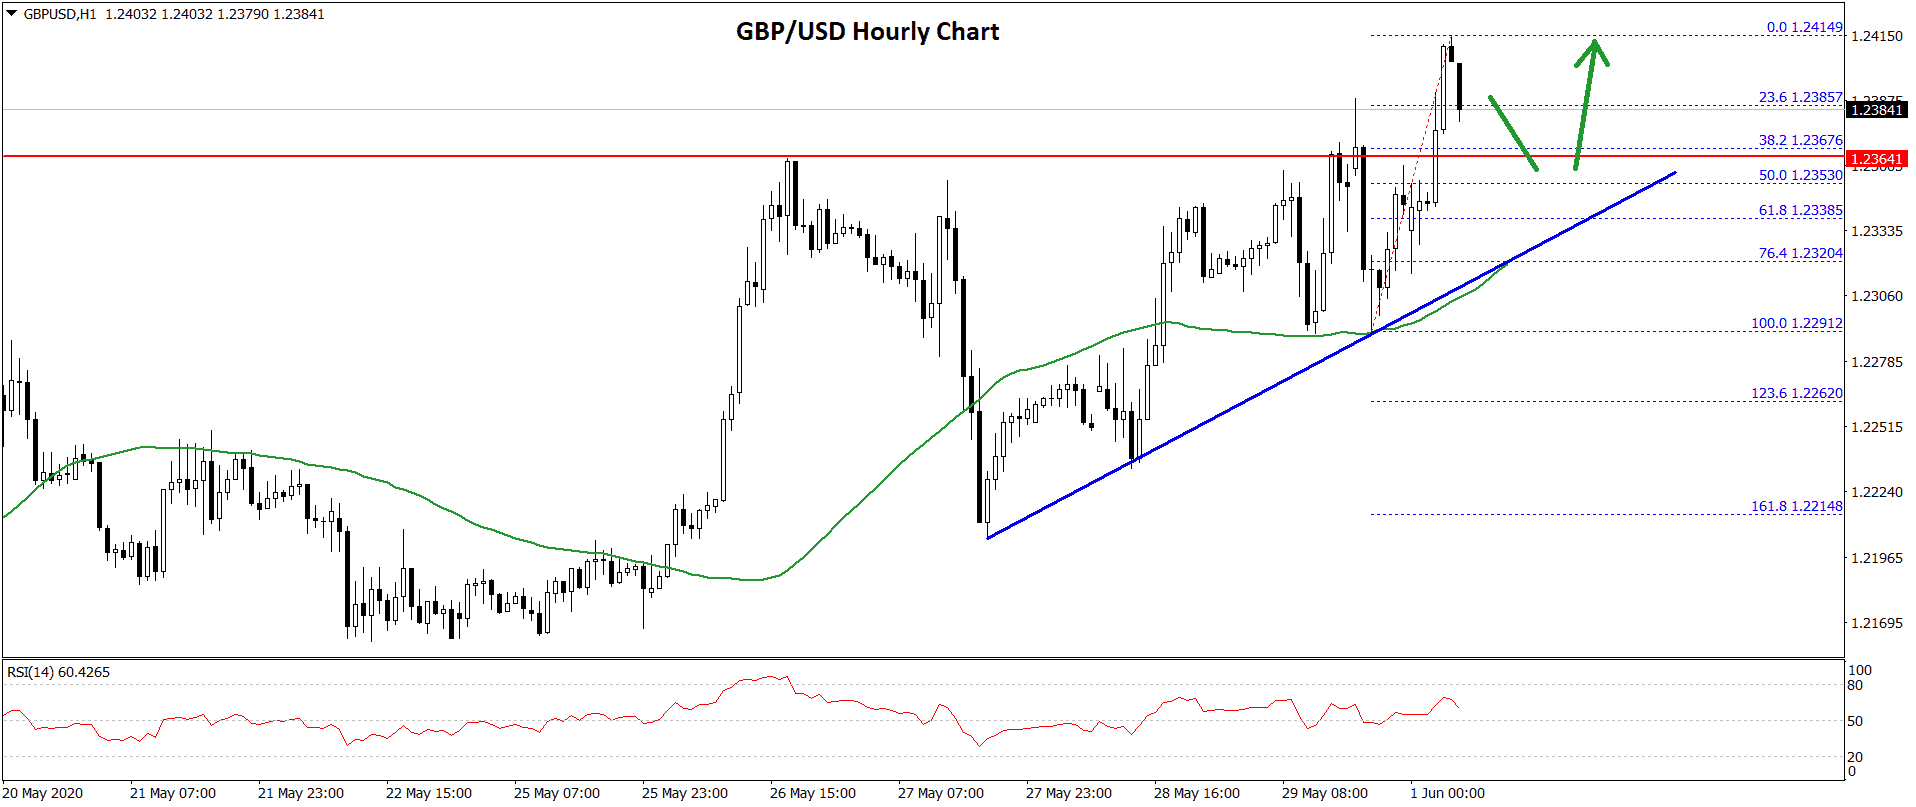
It is currently correcting lower and trading near the 23.6% Fib retracement level of the recent rise from the 1.2291 low to 1.2419 high. On the downside, the first major support is near the 1.2360 and 1.2355 levels.
There is also a key bullish trend line forming with support near 1.2350 on the hourly chart of GBP/USD. The trend line is close to the 50% Fib retracement level of the recent rise from the 1.2291 low to 1.2419 high.
If the pair fails to stay above the 1.2350 support, there is a risk of more losses towards the 1.2300 support zone. Any further losses could lead the pair towards the 1.2260 level.
On the upside, an initial resistance zone is near the 1.2400 zone. A successful daily close above the 1.2400 zone could open the doors for a larger upward move towards the 1.2500 resistance in the near term.
EUR/GBP Technical Analysis
The Euro performed really well and it broke many hurdles near the 0.8950 zone against the British Pound. The EUR/GBP pair even surged above the 0.8980 resistance zone to enter a bullish zone.
There was a close above the 0.9000 level and the 50 hourly simple moving average. The pair traded as high as 0.9054 before the pair started a downside correction.
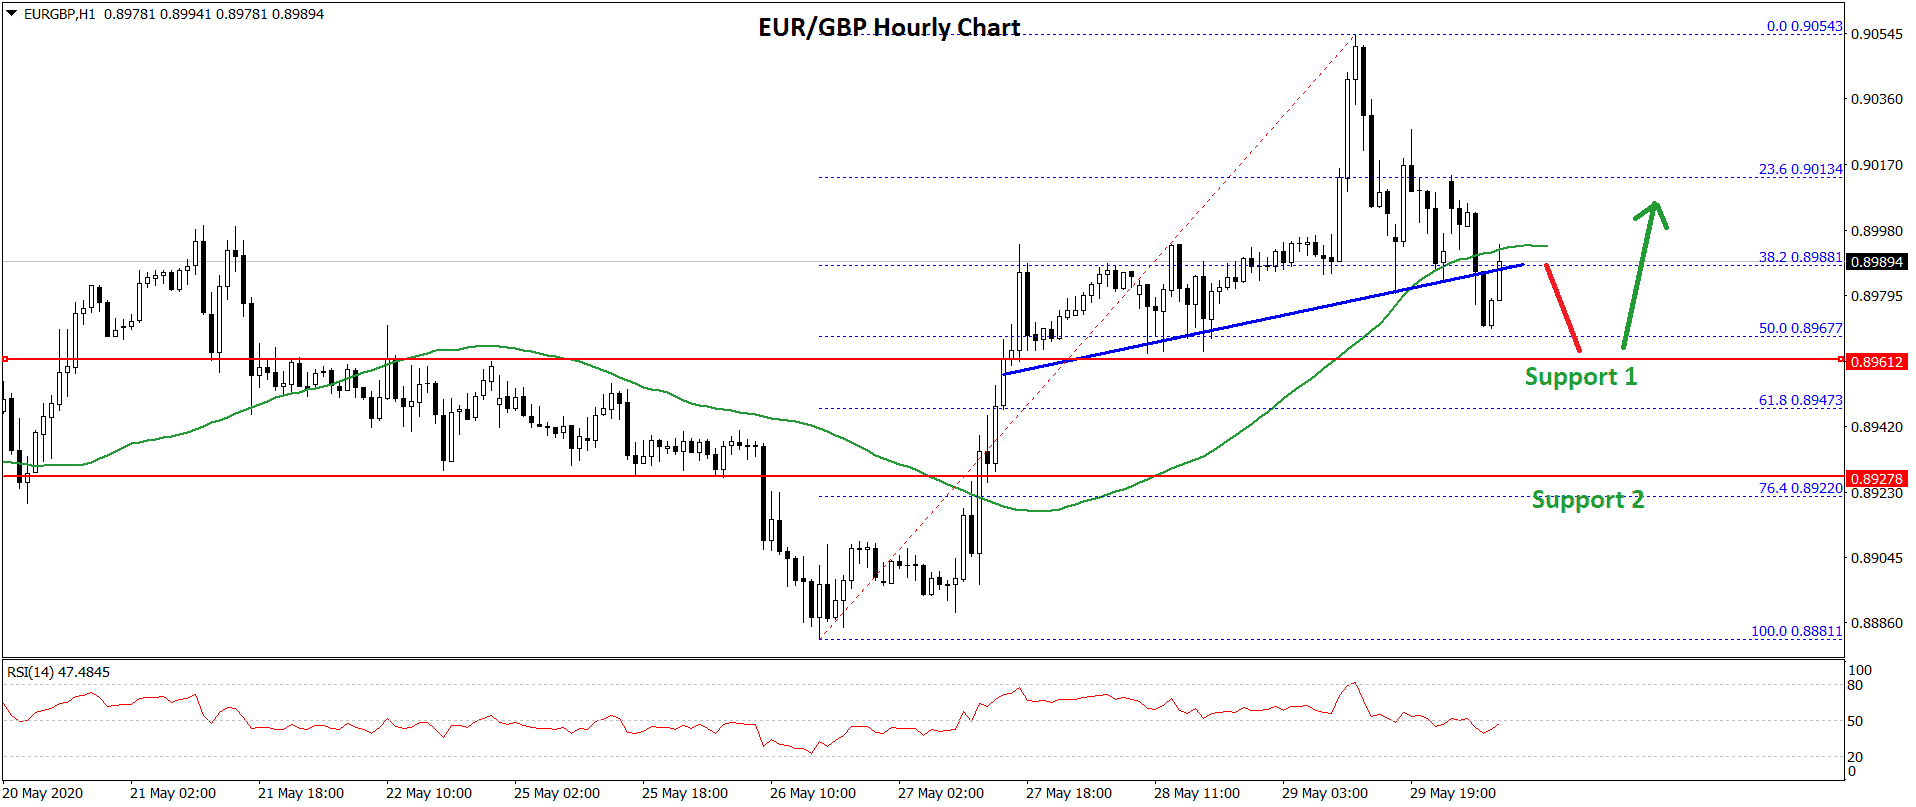
There was a break below the 23.6% Fib retracement level of the upward move from the 0.8881 low to 0.9054 high. Besides, there was a break below a major bullish trend line with support near 0.8985 on the hourly chart.
The pair spiked below the 0.8980 level and the 50 hourly simple moving average. However, the pair found support near the 0.8960 level. The 50% Fib retracement level of the upward move from the 0.8881 low to 0.9054 high also acted as a support.
On the downside, there is a key support forming near the 0.8960 level. Any further losses may perhaps lead the pair towards the 0.8925 support zone.
On the upside, the 0.9020 level is an initial hurdle for the bulls. If there is a break above the 0.9020 zone, there are chances of a push towards 0.9050. Any further gains might call for a test of 0.9100.
Trade over 50 forex markets 24 hours a day with FXOpen. Take advantage of low commissions, deep liquidity, and spreads from 0.0 pips (additional fees may apply). Open your FXOpen account now or learn more about trading forex with FXOpen.
This article represents the opinion of the Companies operating under the FXOpen brand only. It is not to be construed as an offer, solicitation, or recommendation with respect to products and services provided by the Companies operating under the FXOpen brand, nor is it to be considered financial advice.
Stay ahead of the market!
Subscribe now to our mailing list and receive the latest market news and insights delivered directly to your inbox.


Latest articles

Weekly Market Insights with Gary Thomson: US Inflation, UK GDP, and US-China Meeting
In this video, we’ll explore the key economic events and market trends, shaping the financial landscape. Get ready for insights into financial markets to help you navigate the week ahead. Let’s dive in!
In this episode of Market

Silver: Structural Deficit Amid Declining Demand
Fundamental Background
The structural deficit in the silver market has now persisted for a sixth consecutive year. According to forecasts by the Silver Institute, the gap between supply and demand in 2026 is expected to reach 67 million ounces, forcing

EUR/USD — At the Crossroads of Monetary Expectations
Fundamental Background
The fundamental backdrop for EUR/USD in early May is shaped by diverging monetary policy expectations on both sides of the Atlantic. At its 30 April meeting, the ECB left interest rates unchanged; however, Governing Council members Joachim