


GBP/USD and EUR/GBP: British Pound Extending Losses
FXOpen
GBP/USD remained in a significant downtrend and declined below the 1.2100 support. EUR/GBP is trading with a bullish bias with a strong support near 0.9250.
Important Takeaways for GBP/USD and EUR/GBP
- The British Pound declined heavily below the 1.2200 and 1.2100 support levels.
- There is a connecting bearish trend line forming with resistance near 1.2130 on the hourly chart of GBP/USD.
- EUR/GBP climbed higher above the 0.9120 and 0.9200 resistance levels.
- There is a major bullish trend line forming with support near 0.9240 on the hourly chart.
GBP/USD Technical Analysis
The British Pound faced a solid rise in selling pressure after it failed to climb above the 1.2320 resistance against the US Dollar. As a result, the GBP/USD pair started a strong decline and broke the key 1.2200 support area.
The recent decline was such that the pair even broke the 1.2100 support level and the 50 hourly simple moving average. Finally, the pair traded below 1.2050 on FXOpen and formed a new multi-month low near 1.2015.
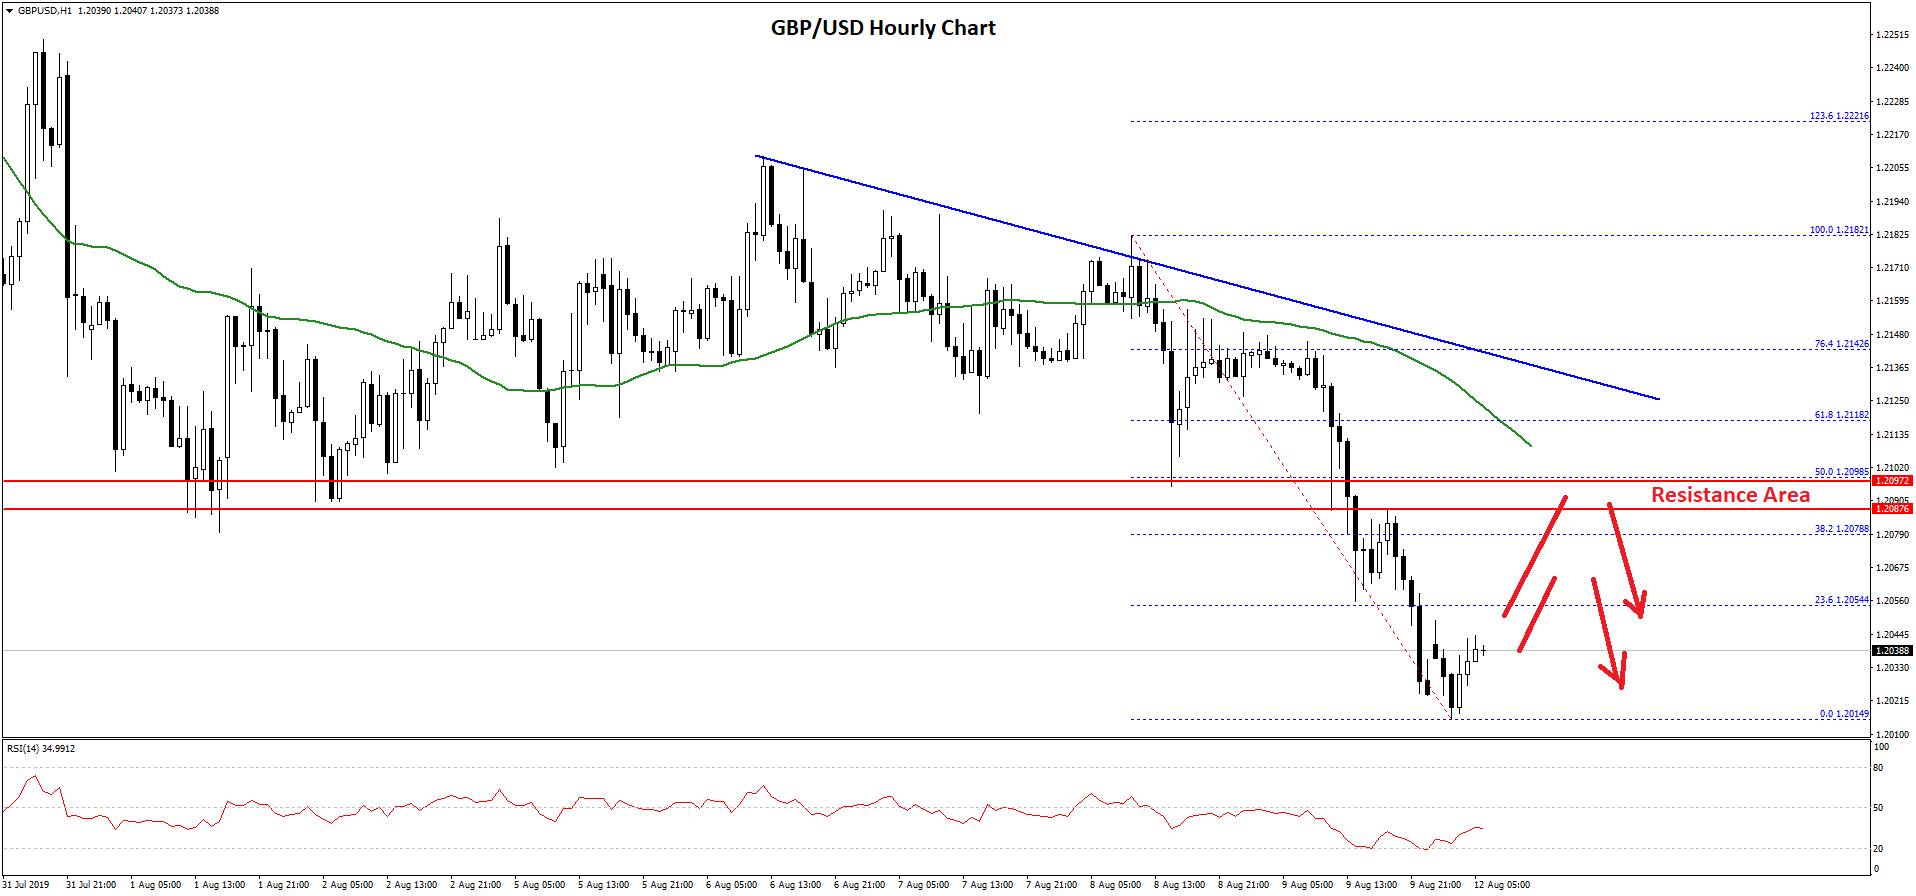
The pair is currently consolidating losses, with an immediate resistance near the 1.2050 level. Moreover, the 23.6% Fib retracement level of the last drop from the 1.2182 high to 1.2014 low is also near the 1.2054 level to stop the recent recovery.
The main resistance on the upside is near the 1.2075, 1.2080 and 1.2100 levels. Moreover, the 50% Fib retracement level of the last drop from the 1.2182 high to 1.2014 low is near the 1.2098 level.
More importantly, there is a connecting bearish trend line forming with resistance near 1.2130 on the hourly chart of GBP/USD. Therefore, upsides are likely to face a lot of hurdles near the 1.2075, 1.2080 and 1.2100 resistance levels.
On the downside, an initial support is near the 1.2020 level. If there is a downside break below the 1.2000 handle, the pair might decline heavily towards the 1.1920 level in the near term.
EUR/GBP Technical Analysis
The Euro remained well bid above the 0.9100 support area against the British Pound. The EUR/GBP pair started a decent upward move and climbed above the 0.9120 and 0.9200 resistance levels.
It opened the doors for more gains and the pair broke the key 0.9250 resistance plus settled well above the 50 hourly simple moving average. Finally, the pair traded above the 0.9300 level and formed a new multi-month high at 0.9324.
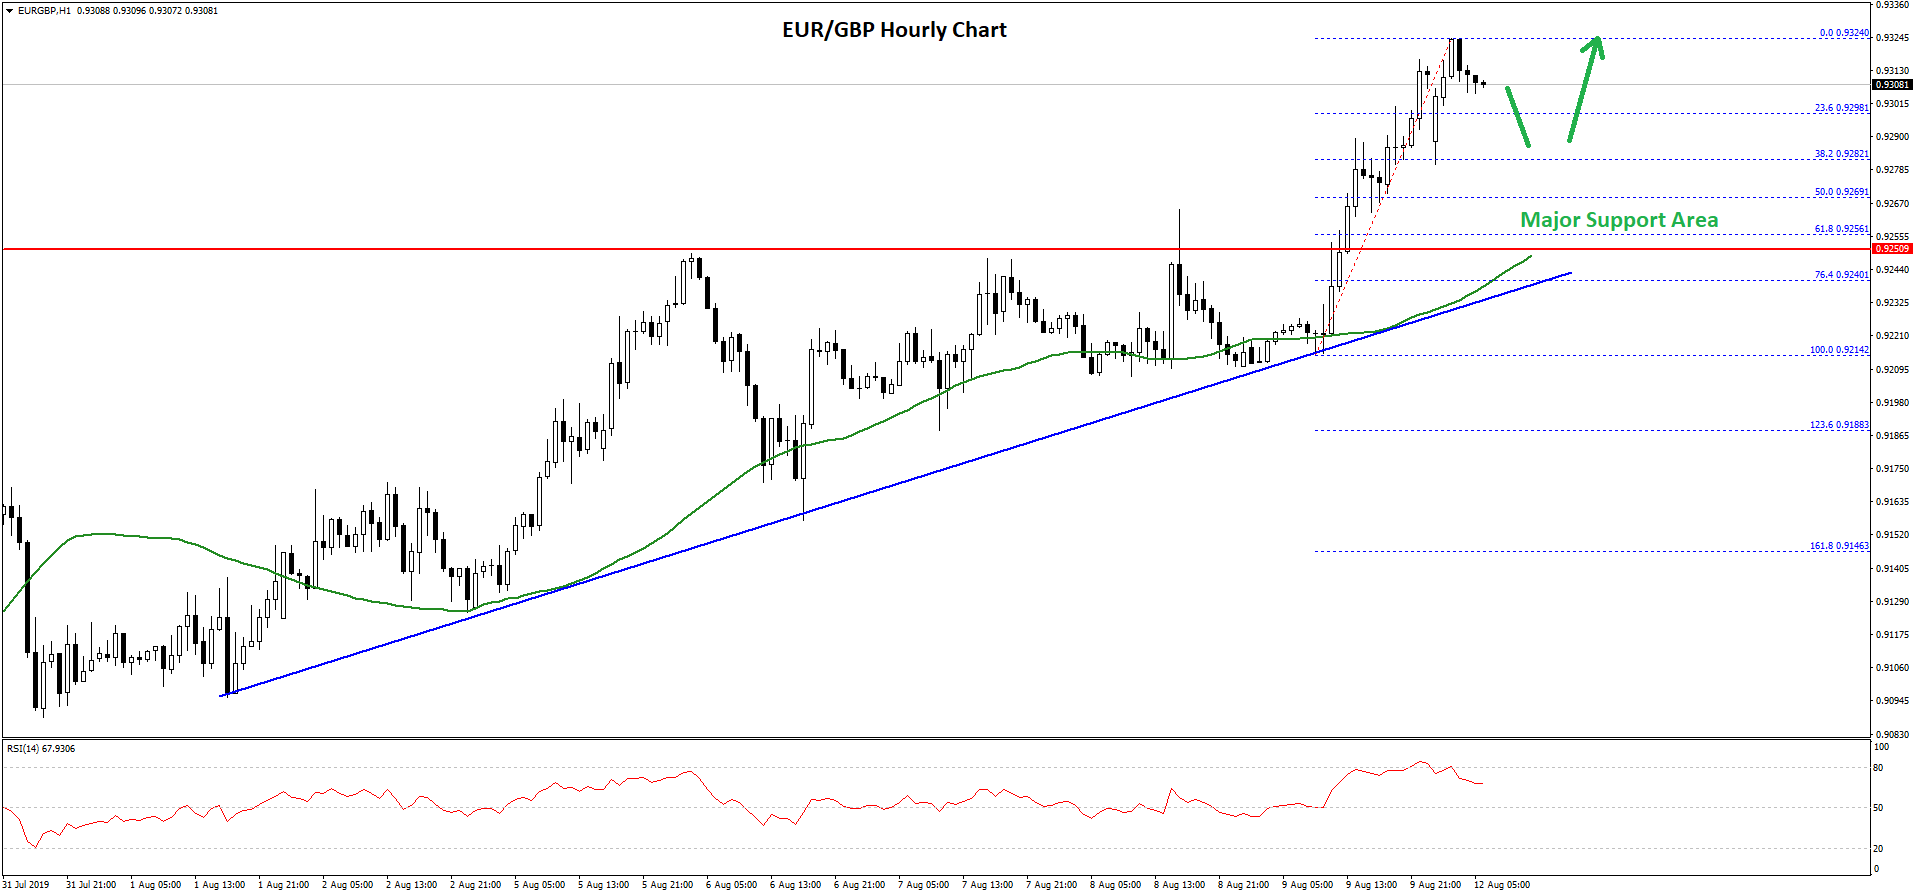
At the moment, the pair is correcting gains below 0.9310. An immediate support is near the 0.9300 level plus the 23.6% Fib retracement level of the recent wave from the 0.9214 low to 0.9324 high.
On the downside, there are many important supports, starting with 0.9280. The next key support is near the 0.9270 level plus the 50% Fib retracement level of the recent wave from the 0.9214 low to 0.9324 high.
The main support is near the 0.9250 level and the 50 hourly simple moving average. Moreover, there is a major bullish trend line forming with support near 0.9240 on the hourly chart of EUR/GBP.
Therefore, a downside correction towards the 0.9275 or 0.9250 support is likely to find a strong buying interest in the near term. Only a close below 0.9240 and the 50 hourly simple moving average might start a major decline.
On the upside, an initial resistance is near the 0.9325 level, above which EUR/GBP could rise towards the 0.9360 and 0.9370 levels in the near term.
Trade over 50 forex markets 24 hours a day with FXOpen. Take advantage of low commissions, deep liquidity, and spreads from 0.0 pips (additional fees may apply). Open your FXOpen account now or learn more about trading forex with FXOpen.
This article represents the opinion of the Companies operating under the FXOpen brand only. It is not to be construed as an offer, solicitation, or recommendation with respect to products and services provided by the Companies operating under the FXOpen brand, nor is it to be considered financial advice.
Stay ahead of the market!
Subscribe now to our mailing list and receive the latest market news and insights delivered directly to your inbox.


Latest articles

Apple: Earnings Day Above the Activity Zone
On 30 April, after the market close, Apple Inc. will release its financial results for the second quarter of fiscal 2026. The consensus forecast, based on estimates from 31 analysts, points to revenue of around $109.7 billion, with expected

USD/JPY and USD/CHF Near Key Levels: The Dollar Supported by the Fed
The US dollar continues to trend upwards following the Federal Reserve meeting, drawing support from the regulator’s moderately hawkish stance and comments by Jerome Powell. Markets interpret the Fed’s rhetoric as a signal that restrictive policy is likely

EUR/USD and GBP/USD consolidate ahead of the Fed decision
European currencies are showing subdued dynamics, entering a consolidation phase following their previous advance. Earlier, EUR/USD and GBP/USD broke out of their ranges and strengthened; however, the subsequent correction has led both pairs to retest the previously breached