


GBP/USD and EUR/GBP: British Pound Facing Uphill Task
FXOpen
GBP/USD remained in a bearish zone and recently declined below the 1.2700 support. EUR/GBP is placed in an uptrend above 0.8880 and it could continue to move higher.
Important Takeaways for GBP/USD and EUR/GBP
- The British Pound declined below the 1.2720 and 1.2700 support levels.
- There is a connecting bullish trend line forming with support near 1.2665 on the hourly chart of GBP/USD.
- EUR/GBP traded higher and recently tested the 0.8920 resistance area.
- There is a key bullish trend line forming with support near 0.8885 on the hourly chart.
GBP/USD Technical Analysis
The British Pound failed to gain pace above the 1.2760 resistance on more than two occasions against the US Dollar. As a result, the GBP/USD pair started a major decline and broke the 1.2720 support area.
The decline was such that the pair even broke the 1.2700 support and the 50 hourly simple moving average. It traded as low as 1.2662 on FXOpen before starting an upside correction.
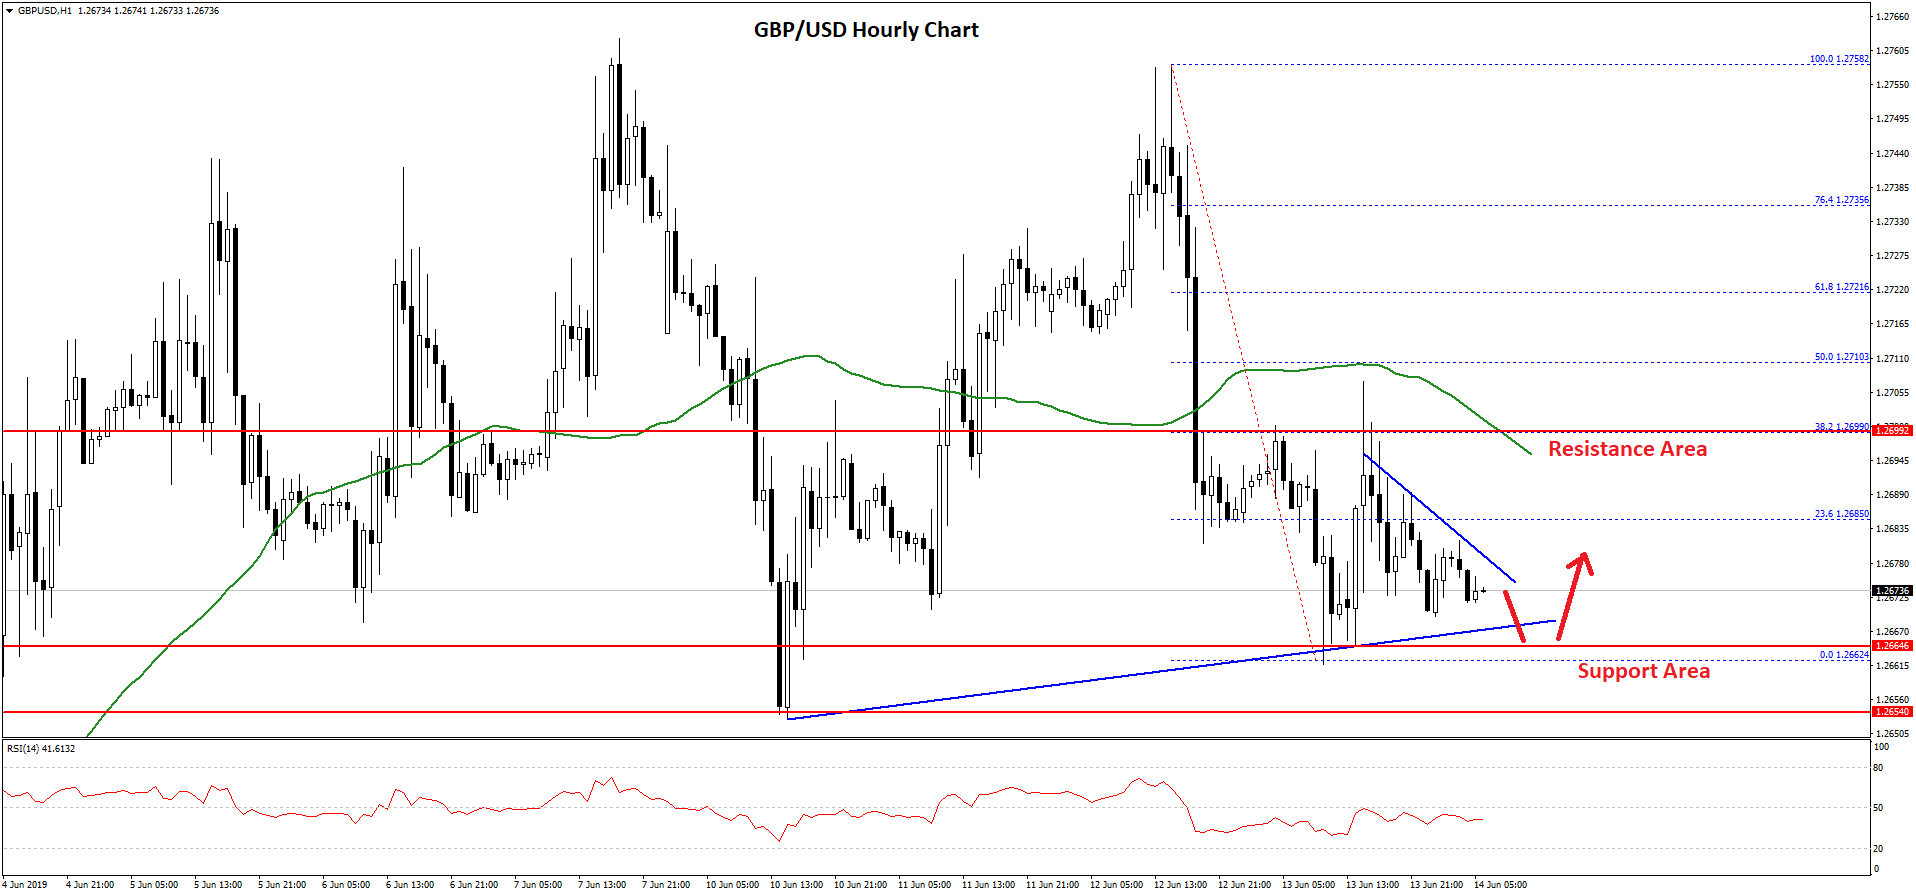
It recovered above the 1.2680 level and the 23.6% Fib retracement level of the latest drop from the 1.2758 high to 1.2662 low. However, the upward move was capped by the 1.2700 resistance area.
Moreover, the 38.2% Fib retracement level of the latest drop from the 1.2758 high to 1.2662 low acted as a strong resistance. The pair is now back below 1.2680 and it is likely to extend losses.
On the downside, there is a connecting bullish trend line forming with support near 1.2665 on the hourly chart of GBP/USD. If there is a break below the trend line support, the pair could extend losses below the 1.2660 and 1.2650 support levels.
Conversely, if the pair starts a decent recovery, it could surpass the 1.2685 and 1.2700 resistance levels. The next key resistance for GBP/USD could be near the 1.2720 level.
EUR/GBP Technical Analysis
The Euro remained in a positive zone above the 0.8800 support area against the British Pound. The EUR/GBP pair traded above the 0.8850 and 0.8860 resistance levels to move into a positive zone.
The pair even settled above the 0.8880 level and the 50 hourly simple moving average. It even spiked above 0.8900 and the last swing high was formed near 0.8919 before the pair started a downside correction.
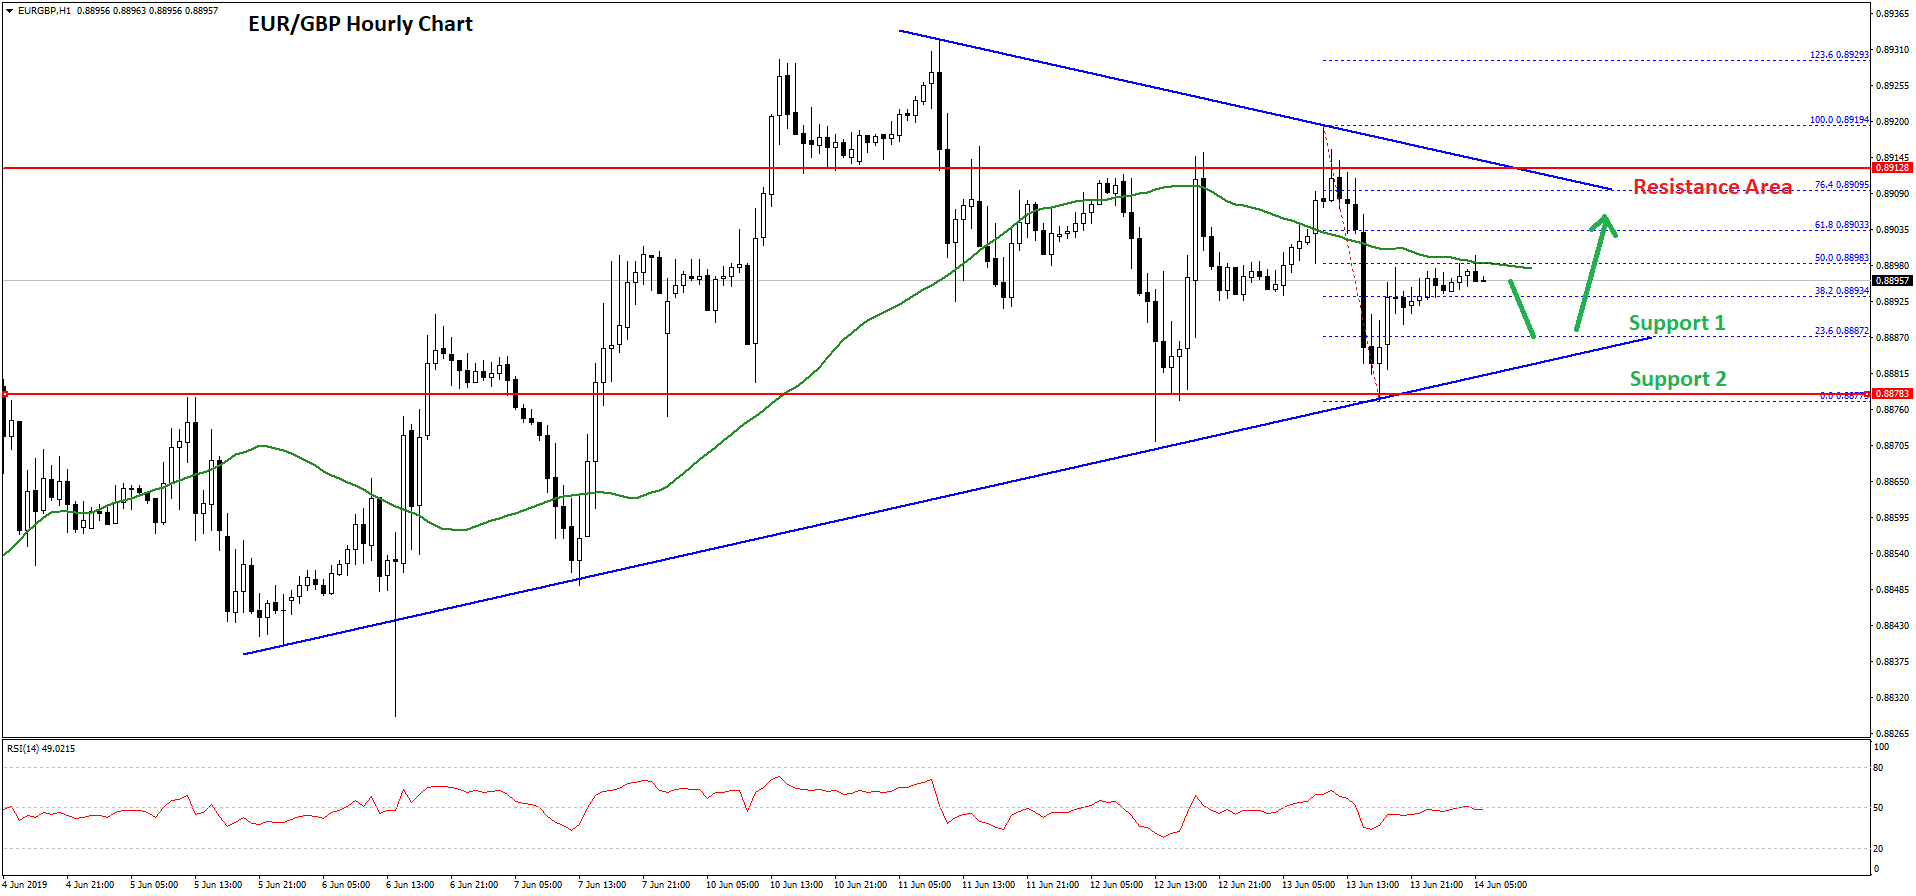
It tested the 0.8880 support area and recently climbed back above 0.8890 plus the 23.6% Fib retracement level of the recent drop from the 0.8919 high to 0.8877 swing low.
However, the upward move is currently capped by the 0.8900 level and the 50 hourly simple moving average. Moreover, the 50% Fib retracement level of the recent drop from the 0.8919 high to 0.8877 swing low is acting as a resistance.
If there is an upside break, the next resistance is near the 0.8910 level and a connecting bearish trend line. If there are further upsides above 0.8910 and 0.8920, the pair could test 0.8950.
On the downside, there is a key bullish trend line forming with support near 0.8885 on the hourly chart. If EUR/GBP breaks the trend line support and 0.8880, there might be a sharp downside correction in the near term. The next main support for the bulls is near 0.8850, where sellers are likely to struggle.
Trade over 50 forex markets 24 hours a day with FXOpen. Take advantage of low commissions, deep liquidity, and spreads from 0.0 pips (additional fees may apply). Open your FXOpen account now or learn more about trading forex with FXOpen.
This article represents the opinion of the Companies operating under the FXOpen brand only. It is not to be construed as an offer, solicitation, or recommendation with respect to products and services provided by the Companies operating under the FXOpen brand, nor is it to be considered financial advice.
Stay ahead of the market!
Subscribe now to our mailing list and receive the latest market news and insights delivered directly to your inbox.


Latest articles

DAX 40: consolidation amid technology sell-off
A wave of selling in the technology sector that emerged earlier this week has weighed on European equities. The trigger was investor concern over the profitability of large-scale debt-funded investments by major US tech companies in AI infrastructure. The Nasdaq

Euro Hits Fresh Yearly Lows Amid Dovish ECB Signals
The euro remains under pressure following weak macroeconomic data from the euro area and fresh signals that the European Central Bank is prepared to maintain a more accommodative monetary policy stance. Data released yesterday pointed to a deterioration in business

Pound at Key Levels: Markets Assess Impact of Political Uncertainty in the UK
The British pound remains under pressure following increased political uncertainty in the United Kingdom triggered by the Prime Minister’s resignation. Investors are assessing potential shifts in the political and economic policy outlook after the head of government stepped down,