


FXOpen
GBP/USD is gaining bullish momentum above the 1.3800 and 1.3840 resistance levels. EUR/GBP is declining and it broke a major support at 0.8745.
Important Takeaways for GBP/USD and EUR/GBP
- The British Pound started a strong increase above the 1.3800 resistance zone.
- There was a break above a major contracting triangle with resistance near 1.3790 on the hourly chart of GBP/USD.
- EUR/GBP started a fresh decline after it failed to clear the main 0.8800 resistance zone.
- There was a break below a key bullish trend line with support near 0.8760 on the hourly chart.
GBP/USD Technical Analysis
After forming a base above the 1.3750 and 1.3780, there was a fresh increase in the British Pound against the US Dollar. The GBP/USD pair broke the 1.3800 and 1.3840 resistance levels to move further into a positive zone.
Moreover, there was a break above a major contracting triangle with resistance near 1.3790 on the hourly chart of GBP/USD. The pair strength and it was able to clear the 1.3850 resistance level.
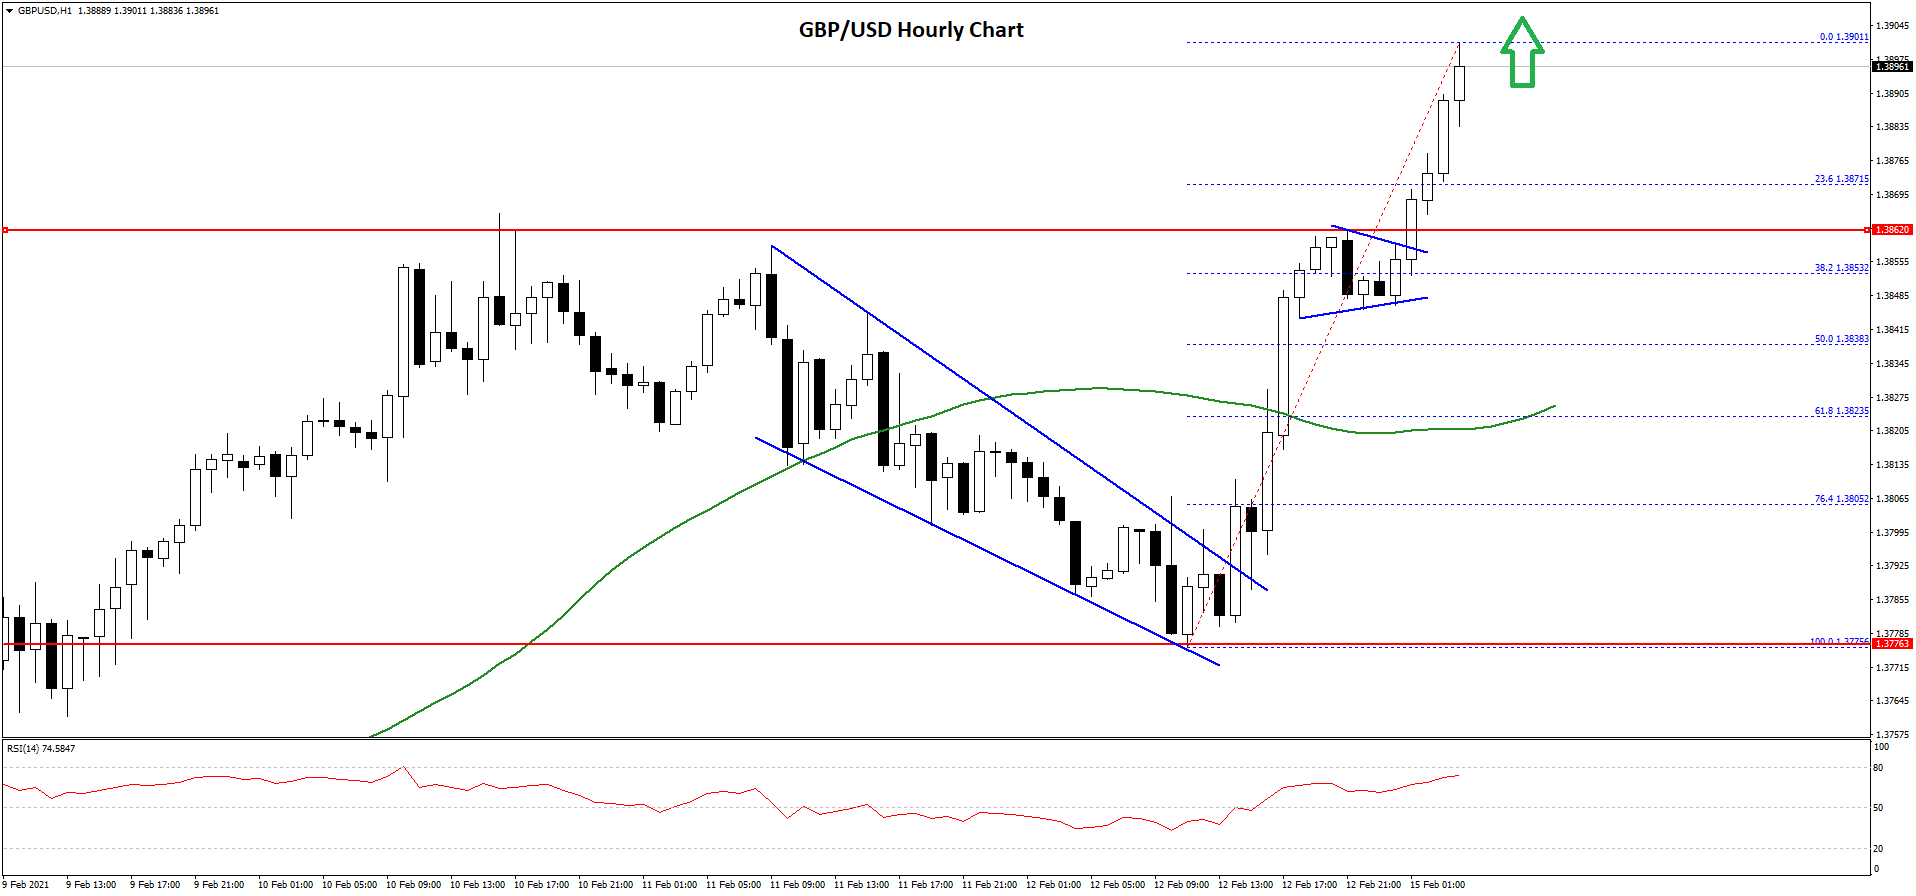
There was also a break above the 1.3880 level and the pair settled nicely above the 50 hourly simple moving average. A new multi-month high is formed near 1.3901 on FXOpen and the pair is currently consolidating gains.
An initial support on the downside is near the 1.3880 level. The first key support is near the 1.3870 level. It is close to the 23.6% Fib retracement level of the upward move from the 1.3775 low to 1.3901 high.
The next key support is near the 1.3850 level. Any more losses may possibly lead the pair towards the 1.3840 level. It coincides with the 50% Fib retracement level of the upward move from the 1.3775 low to 1.3901 high.
On the upside, the 1.3900 level is a short-term resistance. A close above the 1.3900 level will most likely set the pace for a move towards the 1.4000 level in the near term.
EUR/GBP Technical Analysis
The Euro faced a strong selling interest near the 0.8790 and 0.8800 levels against the British Pound. The EUR/GBP pair made many attempts to clear 0.8800, but it failed.
As a result, there was a downside reaction and the pair started a fresh decline from the 0.8790 swing high. The pair broke the 0.8750 support level and settled well below the 50 hourly simple moving average.
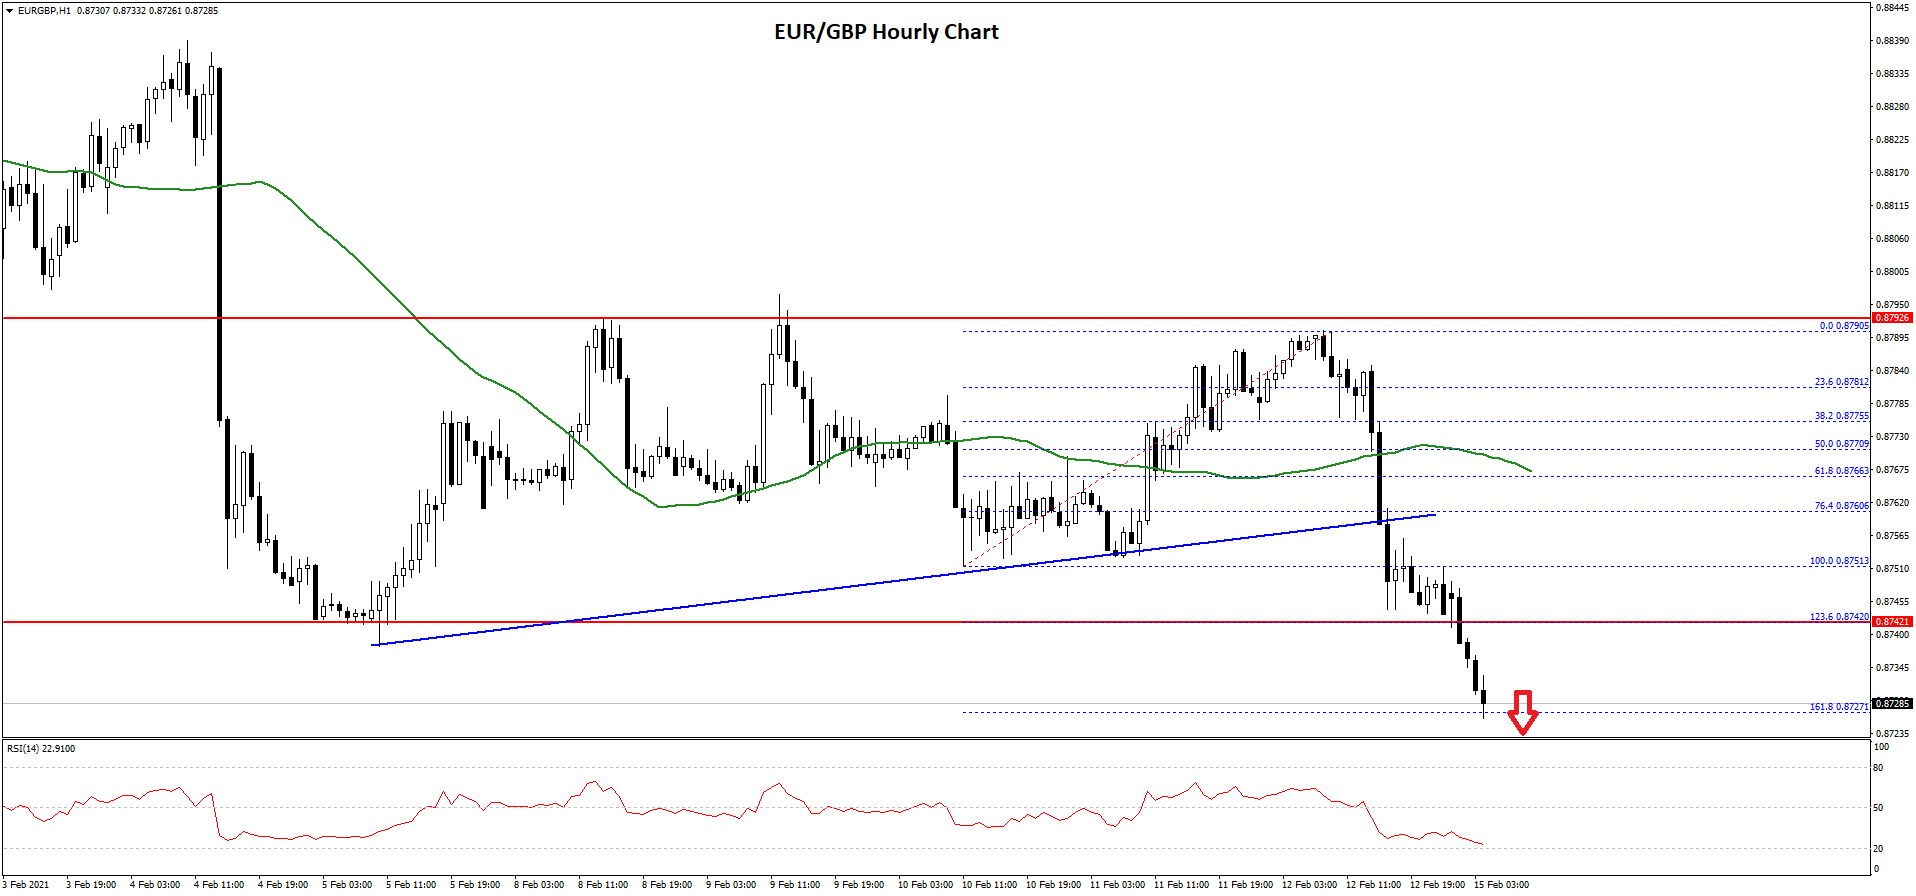
There was also a break below a key bullish trend line with support near 0.8760 on the hourly chart. The pair even broke the 1.236 Fib extension level of the upward move from the 0.8751 low to 0.8790 high.
It is now testing the 0.8725 support zone. It seems like the 1.618 Fib extension level of the upward move from the 0.8751 low to 0.8790 high is acting as a strong support. If there are more downsides, the pair is likely to continue lower towards the 0.8700 level.
On the upside, the previous support near 0.8745 is likely to act as a resistance in the short-term. The first major resistance is near the 0.8765 or the 50 hourly simple moving average.
The main resistance for the Euro bulls is still near the 0.8800 level. A close above the 0.8800 zone might start a steady increase in EUR/GBP in the coming days.
Trade over 50 forex markets 24 hours a day with FXOpen. Take advantage of low commissions, deep liquidity, and spreads from 0.0 pips. Open your FXOpen account now or learn more about trading forex with FXOpen.
This article represents the opinion of the Companies operating under the FXOpen brand only. It is not to be construed as an offer, solicitation, or recommendation with respect to products and services provided by the Companies operating under the FXOpen brand, nor is it to be considered financial advice.
Stay ahead of the market!
Subscribe now to our mailing list and receive the latest market news and insights delivered directly to your inbox.

Latest from Forex Analysis
Latest articles

Weekly Market Wrap With Gary Thomson: Nasdaq, EUR/USD, USD/CHF, Brent Crude Oil, Googl Shares
Get the latest scoop on the week's hottest headlines, all in one convenient video. Join Gary Thomson, the COO of FXOpen UK, as he breaks down the most significant news reports and shares his expert insights.
- Nasdaq Composite: Worst Session

Analysis of AUD/USD: Exchange Rate Falls to Early May Low
As indicated by the 4-hour AUD/USD chart today:
→ the rate fell below 0.652, a level last seen on May 2;
→ the RSI indicator dropped below 15, a level last seen during the panic over the spread of COVID-19

Analysis of AMZN Stock: Price at 1.5-Month Low
As shown in the AMZN chart, the stock price dropped below:
→ the psychological level of $180;
→ the mid-June interim low.
The last time AMZN traded below $180 was in early June.
Thus, AMZN has faced sell-offs, similar to other tech