


GBP/USD And EUR/GBP: British Pound Nosedived
FXOpen

GBP/USD declined heavily below the 1.3050 and 1.2950 support levels. EUR/GBP climbed higher sharply and it broke the key 0.9200 resistance zone.
Important Takeaways for GBP/USD and EUR/GBP
- The British Pound faced an increase in selling pressure below the 1.3000 support level.
- There is a major bearish trend line forming with resistance near 1.2870 on the hourly chart of GBP/USD.
- EUR/GBP is rising and it settled above the 0.9200 resistance zone.
- There is a crucial bullish trend line forming with support near 0.9185 on the hourly chart.
GBP/USD Technical Analysis
The British Pound started a strong decline from well above the 1.3200 support zone against the US Dollar. The GBP/USD pair traded below many key supports near 1.3000 to move into a bearish zone.
The pair gained bearish momentum below the 1.2950 support level and the 50 hourly simple moving average. It even broke the 1.2800 support zone and traded as low as 1.2762 on FXOpen.
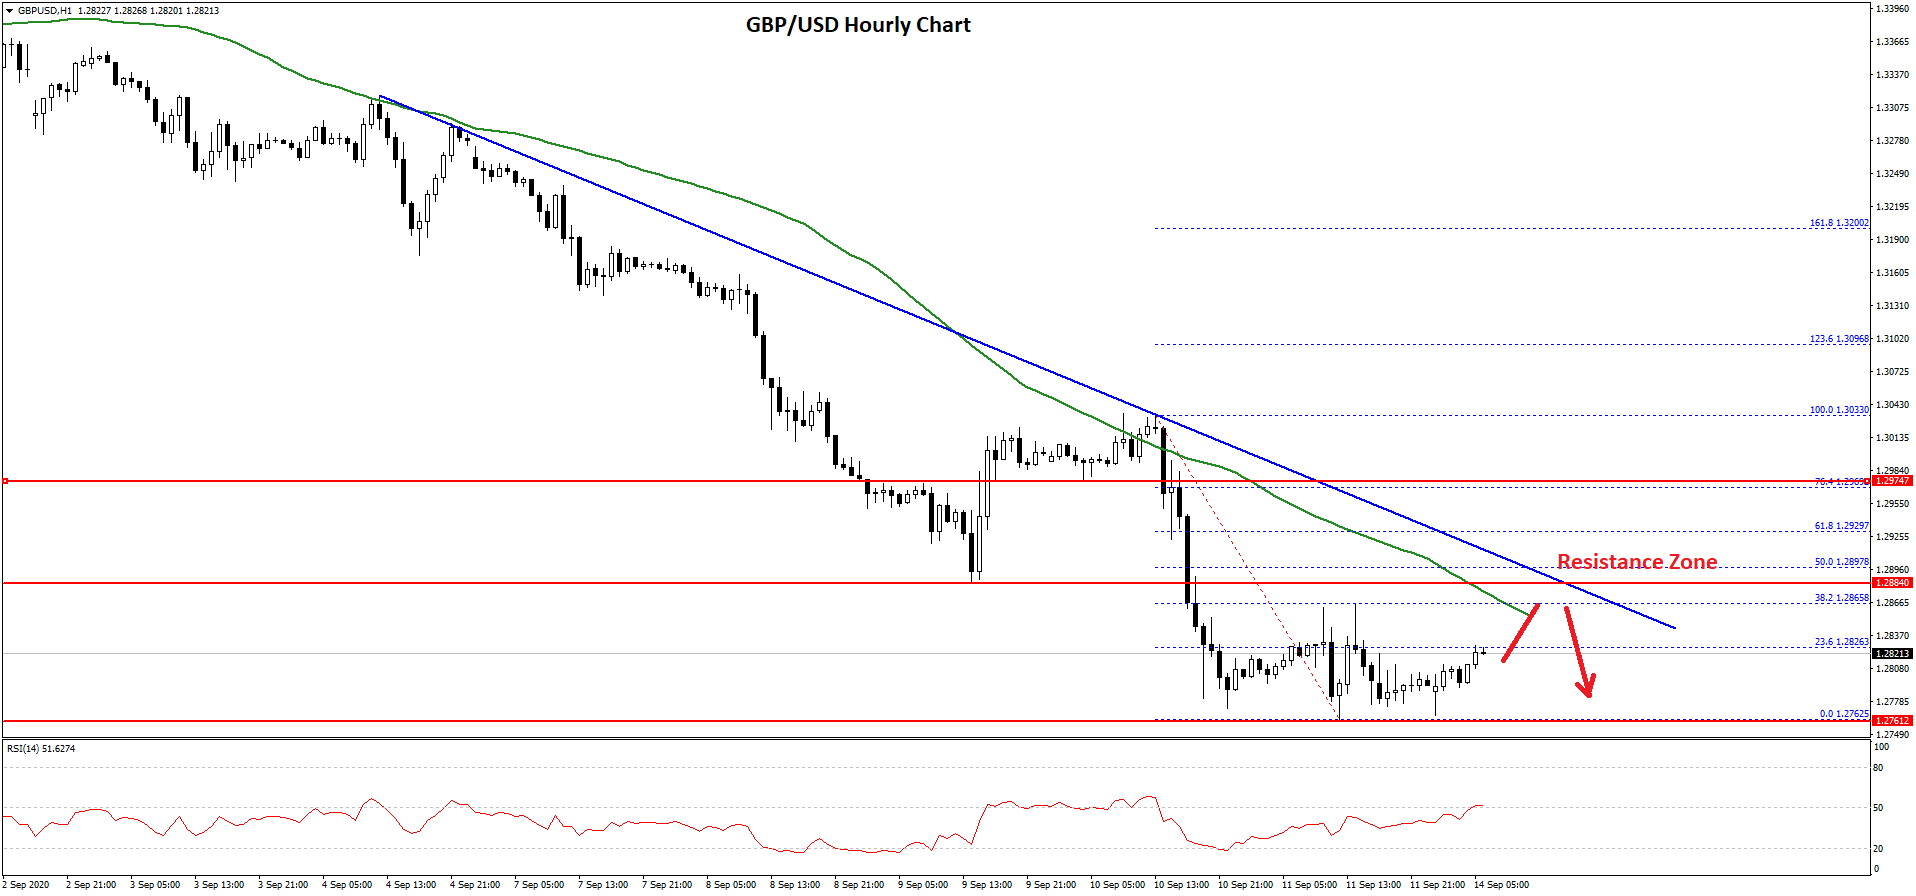
It is currently consolidating losses and trading near the 1.2825 level. It is close to the 23.6% Fib retracement level of the recent decline from the 1.3033 high to 1.2762 low. On the upside, the first key resistance is near the 1.2850 level and the 50 hourly simple moving average.
There is also a major bearish trend line forming with resistance near 1.2870 on the hourly chart of GBP/USD. The trend line is close to the 50% Fib retracement level of the recent decline from the 1.3033 high to 1.2762 low.
Therefore, the pair must break the trend line resistance and then gain pace above the 1.2900 level to start a recovery wave. The next key hurdles are near 1.2980 and 1.3000.
Conversely, the pair might continue to move down below the 1.2800 support. A break below the 1.2762 low could open the doors for more losses. The next key support is near the 1.2720 level, below which it could test 1.2660.
EUR/GBP Technical Analysis
The Euro started a strong upward move after it settled above the 0.9000 handle against the British Pound. The EUR/GBP pair broke the 0.9080 resistance zone to move further into the positive zone.
The pair gained pace above the key 0.9200 resistance and it settled above the 50 hourly simple moving average. Finally, the pair traded as high as 0.9291 and it is currently correcting lower.
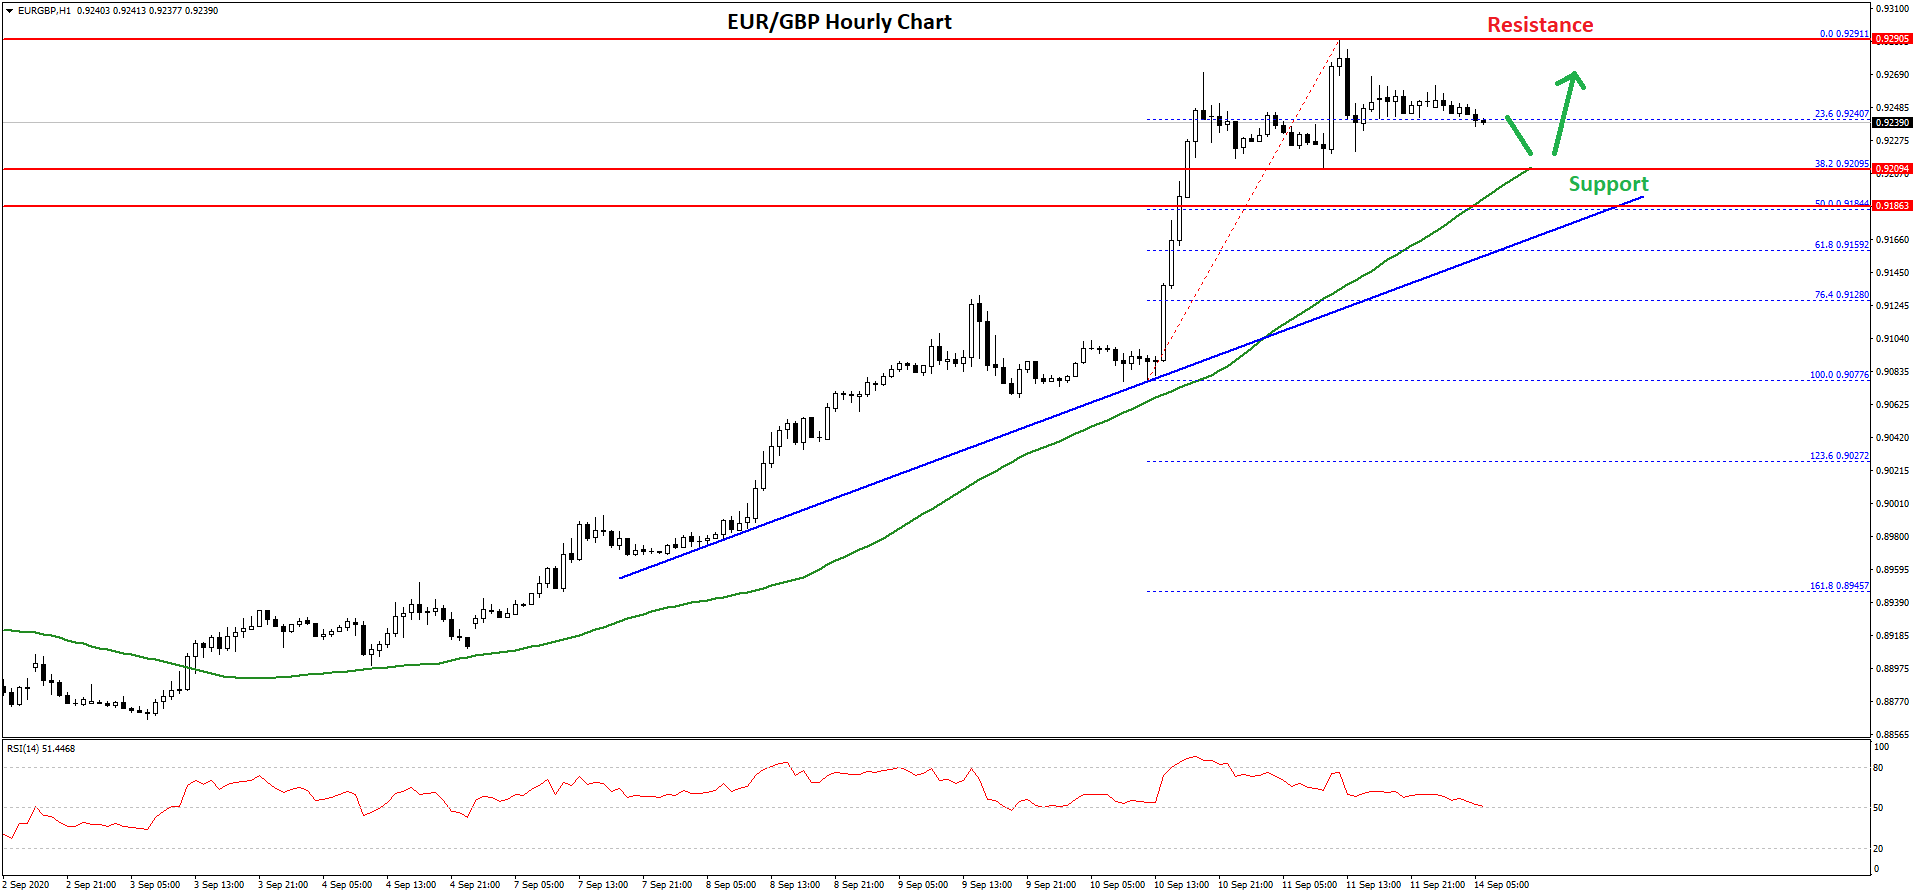
It is testing the 0.9240 support and the 23.6% Fib retracement level of the recent rise from the 0.9077 low to 0.9291 high. The first major support is near the 0.9210 and 0.9200 levels. There is also a crucial bullish trend line forming with support near 0.9185 on the hourly chart.
The trend line is close to the 50 hourly simple moving average and the 50% Fib retracement level of the recent rise from the 0.9077 low to 0.9291 high.
If there is a downside break below the trend line, the pair could start a strong downside correction. The next major support is near the 0.9120 level.
Conversely, the EUR/GBP pair could continue to move up above the 0.9260 level. The first major resistance is near the 0.9290 and 0.9300 levels. A close above the 0.9300 level may perhaps push the pair towards the 0.9380 level in the coming days.
Trade over 50 forex markets 24 hours a day with FXOpen. Take advantage of low commissions, deep liquidity, and spreads from 0.0 pips (additional fees may apply). Open your FXOpen account now or learn more about trading forex with FXOpen.
This article represents the opinion of the Companies operating under the FXOpen brand only. It is not to be construed as an offer, solicitation, or recommendation with respect to products and services provided by the Companies operating under the FXOpen brand, nor is it to be considered financial advice.
Stay ahead of the market!
Subscribe now to our mailing list and receive the latest market news and insights delivered directly to your inbox.


Latest articles

DAX 40: consolidation amid technology sell-off
A wave of selling in the technology sector that emerged earlier this week has weighed on European equities. The trigger was investor concern over the profitability of large-scale debt-funded investments by major US tech companies in AI infrastructure. The Nasdaq

Euro Hits Fresh Yearly Lows Amid Dovish ECB Signals
The euro remains under pressure following weak macroeconomic data from the euro area and fresh signals that the European Central Bank is prepared to maintain a more accommodative monetary policy stance. Data released yesterday pointed to a deterioration in business

Pound at Key Levels: Markets Assess Impact of Political Uncertainty in the UK
The British pound remains under pressure following increased political uncertainty in the United Kingdom triggered by the Prime Minister’s resignation. Investors are assessing potential shifts in the political and economic policy outlook after the head of government stepped down,