


FXOpen
GBP/USD failed to gain pace above 1.3060-70 and declined recently below the 1.2950 support. EUR/GBP traded higher recently and it is currently well supported above the 0.8820 level.
Important Takeaways for GBP/USD and EUR/GBP
- The British Pound declined below the 1.3000 and 1.2950 support levels.
- There is a crucial bearish trend line in place with resistance at 1.2960 on the hourly chart of GBP/USD.
- EUR/GBP is currently trading well above the key 0.8800 support area.
- There is a major bullish trend line formed with support at 0.8800 on the hourly chart.
GBP/USD Technical Analysis
The British Pound formed traded towards the 1.3200 resistance this past week against the US Dollar. The GBP/USD pair failed to break the 1.3200 resistance and later started a downside move.
The pair declined heavily and broke the 1.3120, 1.3000 and 1.2950 support levels. There was also a close below the key 1.2950 support and the 50 hourly simple moving average. The decline was such that sellers pushed the price below the 1.2800 level.
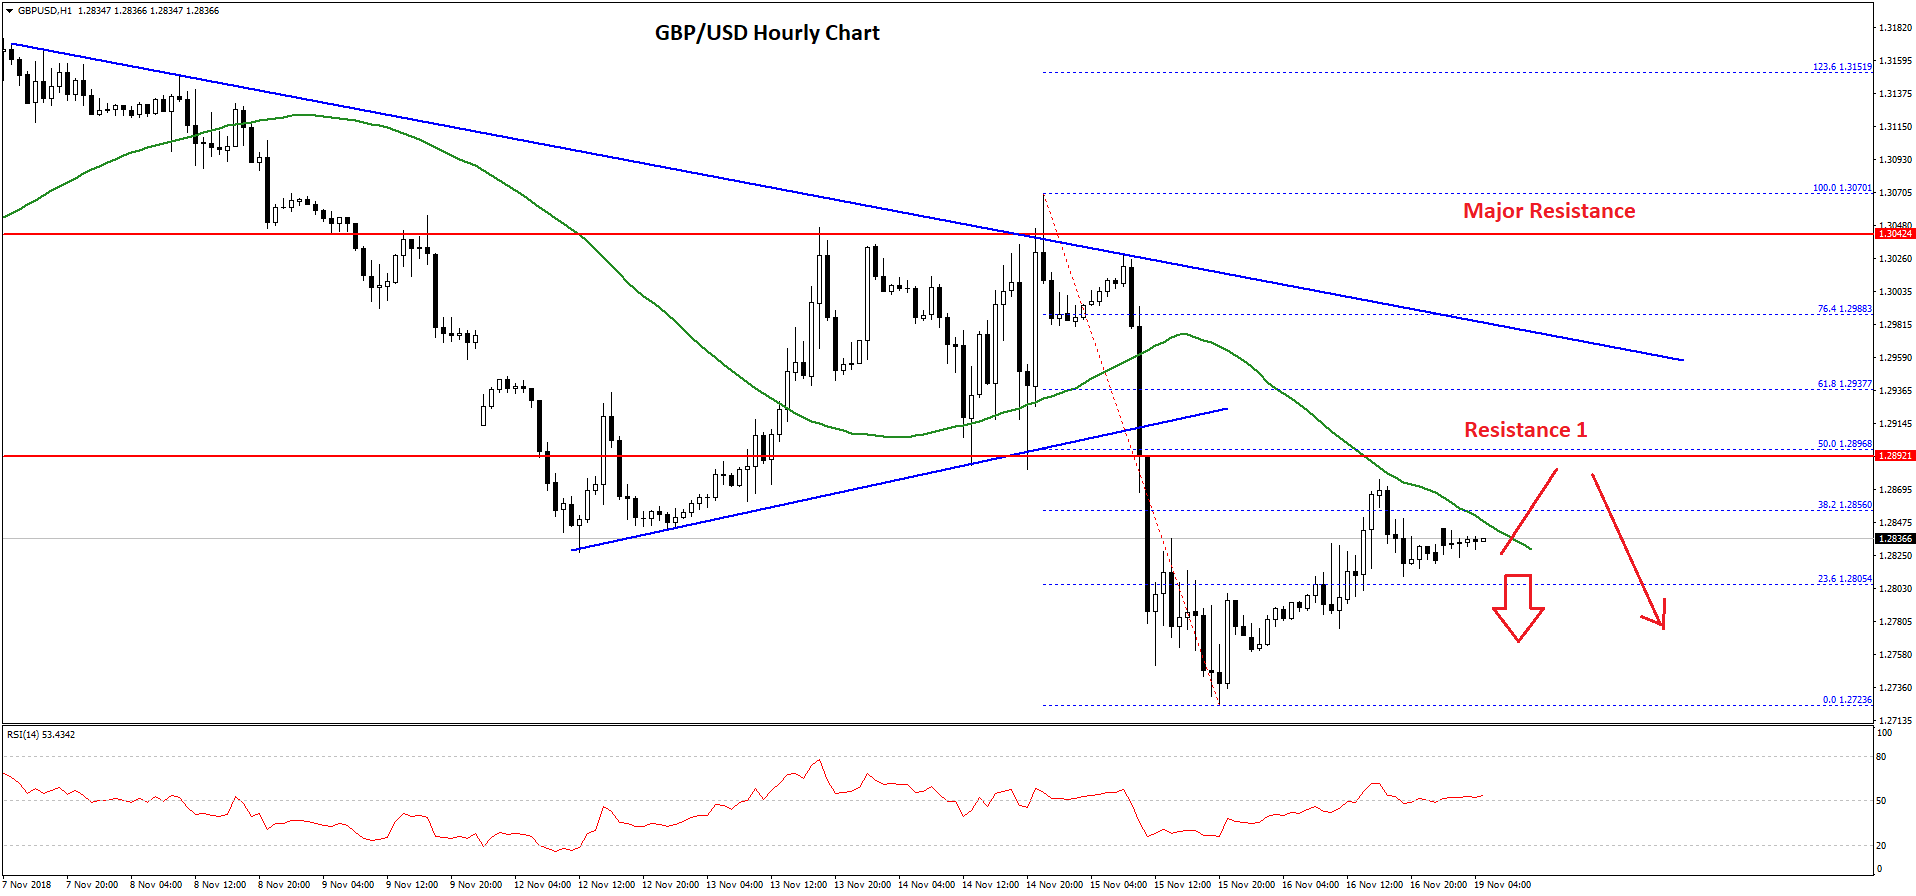
During the decline, there was a break below a bullish trend line with support at 1.2920 on the hourly chart. A new weekly low was formed at 1.2772 on FXOpen and later the pair started an upside correction.
The pair recovered above the 1.2800 resistance and the 23.6% Fib retracement level of the last decline from the 1.3070 high to 1.2772 low. However, the pair seems to be struggling near the 1.2880 level and the 50 hourly simple moving average.
Besides, there is a crucial bearish trend line in place with resistance at 1.2960 on the same chart. Before the trend line, the 1.2900 resistance is important along with the 50% Fib retracement level of the last decline from the 1.3070 high to 1.2772 low.
Therefore, if the pair continues to correct higher, it is likely to face a solid selling interest near the 1.2900 and 1.2920 resistance levels. On the downside, an initial support awaits at 1.2800, below which the pair could trade towards the 1.2750 level.
EUR/GBP Technical Analysis
The Euro formed a solid support near the 0.8660 level against the British Pound. The EUR/GBP pair started an upward move and traded above the 0.8700 and 0.8770 resistance levels.
The recent wave was bullish since the pair moved above the 0.8800 resistance and the 50 hourly simple moving average. The upward move was such that the pair tested the 0.8900 resistance level.
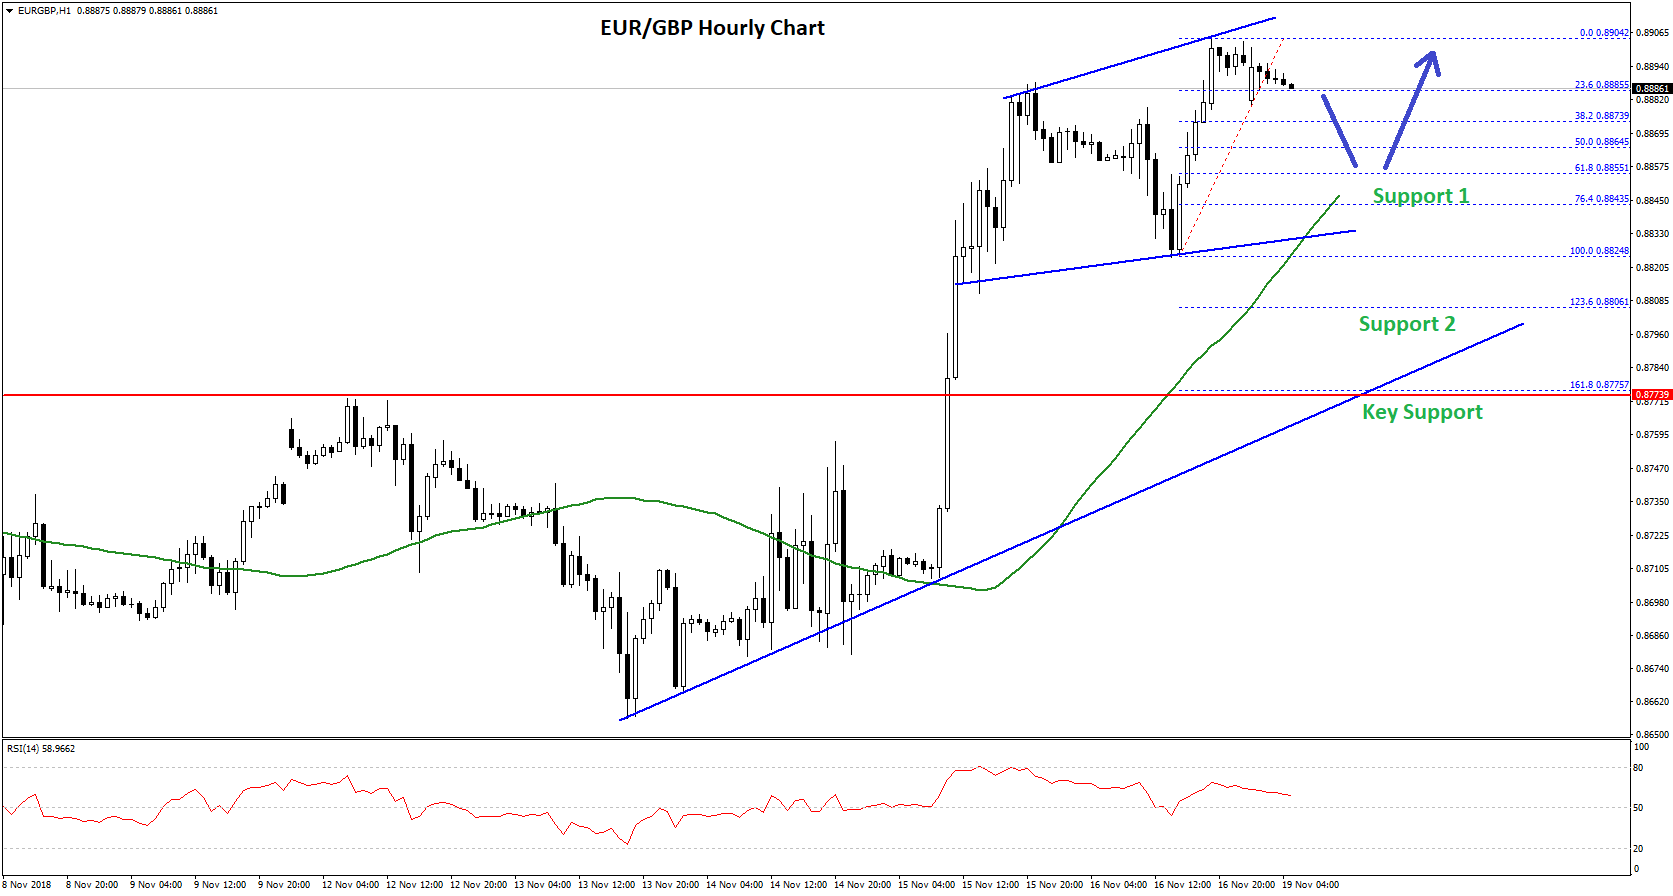
A high was formed at 0.8904 and later the pair started consolidating gains. An initial support is near 0.8860 and the 50% Fib retracement level of the last wave from the 0.8824 low to 0.8904 high.
However, the key support is near the 0.8840 level and the 50 hourly SMA since it coincides with a connecting bullish trend line on the hourly chart plus the 76.4% Fib retracement level of the last wave from the 0.8824 low to 0.8904 high.
More importantly, there is a major bullish trend line formed with support at 0.8800 on the same chart. Therefore, if the pair corrects lower from the current levels, it will most likely find a strong buying interest near the 0.8860 and 0.8840 levels. The main pivot zone is at 0.8800, below which the pair could move into a bearish zone.
On the upside, an initial resistance is at 0.8900, above which EUR/GBP could trade above the 0.8920 resistance for an extended move towards the 0.8950 level.
Trade over 50 forex markets 24 hours a day with FXOpen. Take advantage of low commissions, deep liquidity, and spreads from 0.0 pips. Open your FXOpen account now or learn more about trading forex with FXOpen.
This article represents the opinion of the Companies operating under the FXOpen brand only. It is not to be construed as an offer, solicitation, or recommendation with respect to products and services provided by the Companies operating under the FXOpen brand, nor is it to be considered financial advice.
Stay ahead of the market!
Subscribe now to our mailing list and receive the latest market news and insights delivered directly to your inbox.

Latest from Forex Analysis
Latest articles

Weekly Market Wrap With Gary Thomson: Nasdaq, EUR/USD, USD/CHF, Brent Crude Oil, Googl Shares
Get the latest scoop on the week's hottest headlines, all in one convenient video. Join Gary Thomson, the COO of FXOpen UK, as he breaks down the most significant news reports and shares his expert insights.
- Nasdaq Composite: Worst Session

Analysis of AUD/USD: Exchange Rate Falls to Early May Low
As indicated by the 4-hour AUD/USD chart today:
→ the rate fell below 0.652, a level last seen on May 2;
→ the RSI indicator dropped below 15, a level last seen during the panic over the spread of COVID-19

Analysis of AMZN Stock: Price at 1.5-Month Low
As shown in the AMZN chart, the stock price dropped below:
→ the psychological level of $180;
→ the mid-June interim low.
The last time AMZN traded below $180 was in early June.
Thus, AMZN has faced sell-offs, similar to other tech