


GBP/USD and GBP/JPY: British Pound Could Gain Strength
FXOpen

GBP/USD started a fresh increase after a drop to 1.3580. Similarly, GBP/JPY started a decent increase and it broke the 151.00 resistance zone.
Important Takeaways for GBP/USD and GBP/JPY
- The British Pound traded as low as 1.3571 before climbing higher against the US Dollar.
- There was a break above a major bearish trend line with resistance near 1.3700 on the hourly chart of GBP/USD.
- GBP/JPY also climbed higher above the 150.00 and 151.00 resistance levels.
- There was a break above a key bearish trend line with resistance near 150.15 on the hourly chart.
GBP/USD Technical Analysis
This past week, there was a strong decline in the British Pound below the 1.3800 level against the US Dollar. The GBP/USD pair even broke the 1.3700 and 1.3650 support levels.
It traded as low as 1.3571 on FXOpen before it started a fresh increase. There was a steady upward move above the 1.3650 resistance level. The price surpassed the 1.3680 resistance level and the 50 hourly simple moving average.
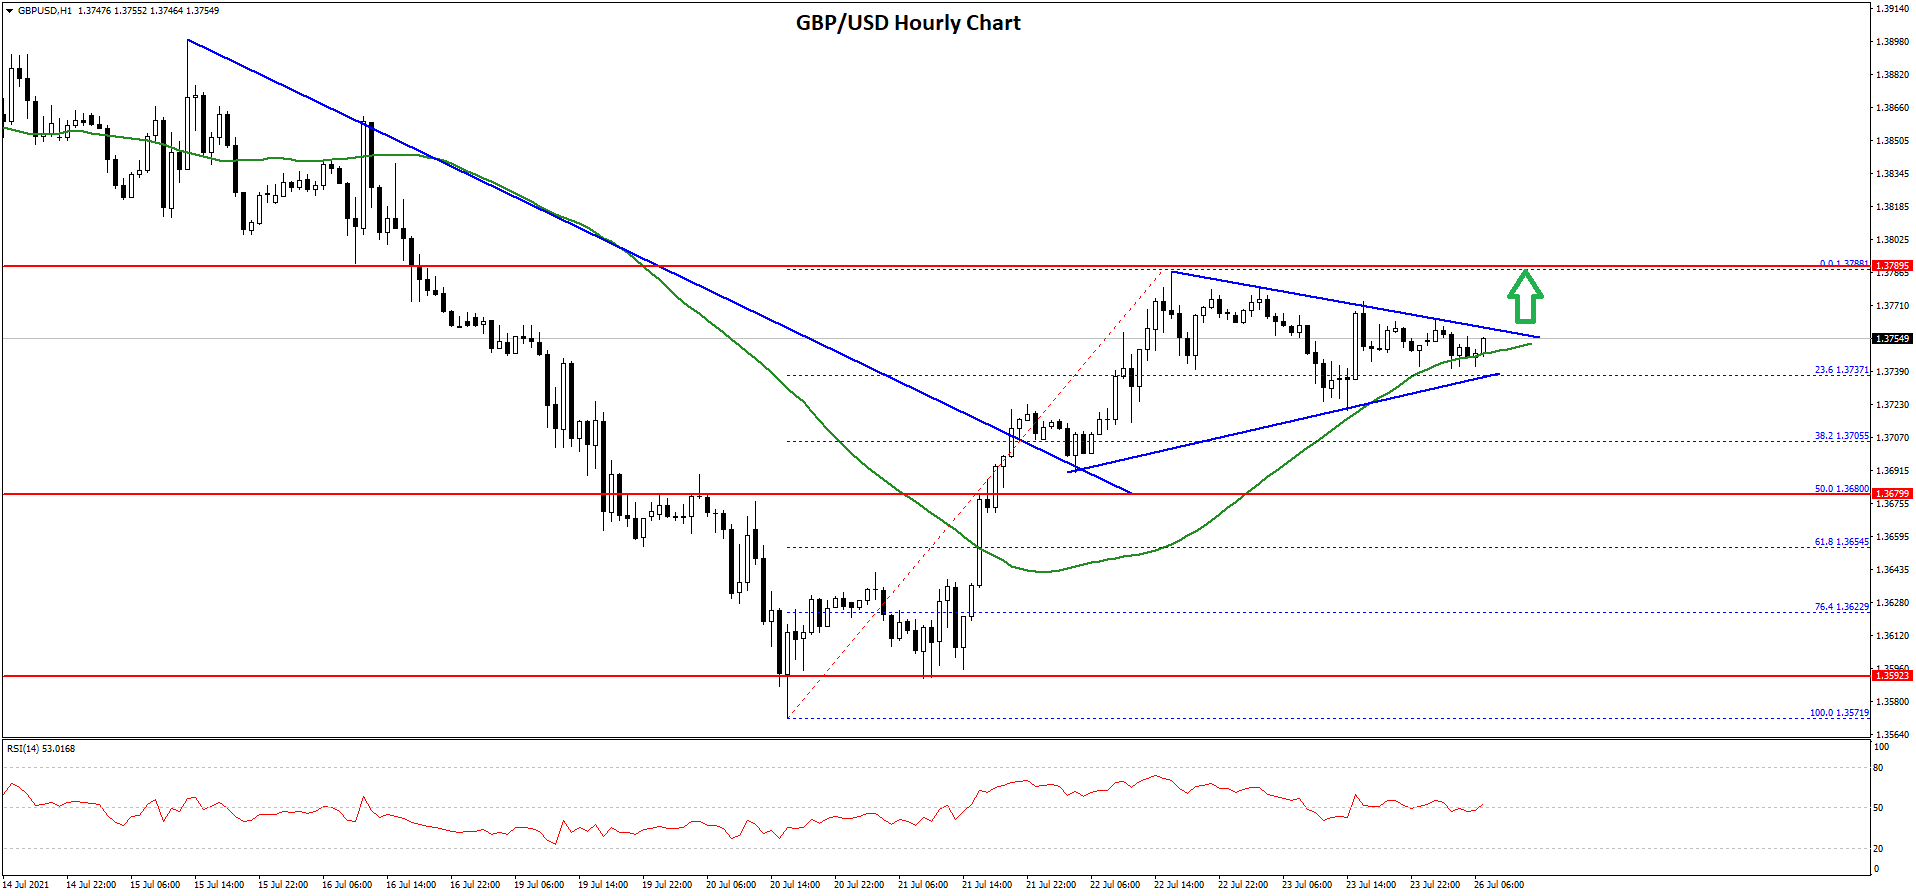
There was also a break above a major bearish trend line with resistance near 1.3700 on the hourly chart of GBP/USD. The pair is now trading nicely above the 1.3750 level.
It traded as high as 1.3798 before correcting lower. There was a break below the 1.3760 level. The pair tested the 23.6% Fib retracement level of the recent increase from the 1.3571 low to 1.3798 high. It is now trading inside a contracting triangle with resistance near 1.3760.
A clear break above the triangle resistance could set the pace for a larger increase above 1.3780. The next key resistance is near 1.3800, above which the pair could rise towards the 1.3880 level.
On the downside, an initial support is near the 1.3735 level and the 50 hourly SMA. If there is a break below the 1.3735 support, the pair could test the 1.3700 support. If there are additional losses, the pair could decline towards the 1.3650 level.
GBP/JPY Technical Analysis
The British Pound also followed a similar path after it declined from well above 152.50 against the Japanese Yen. The GBP/JPY pair tested the 148.50 support zone, where the bulls appeared.
A low was formed near 148.46 before the pair recovered above 150.00. There was a break above a key bearish trend line with resistance near 150.15 on the hourly chart. The pair even traded above the 151.00 level and the 50 hourly simple moving average.
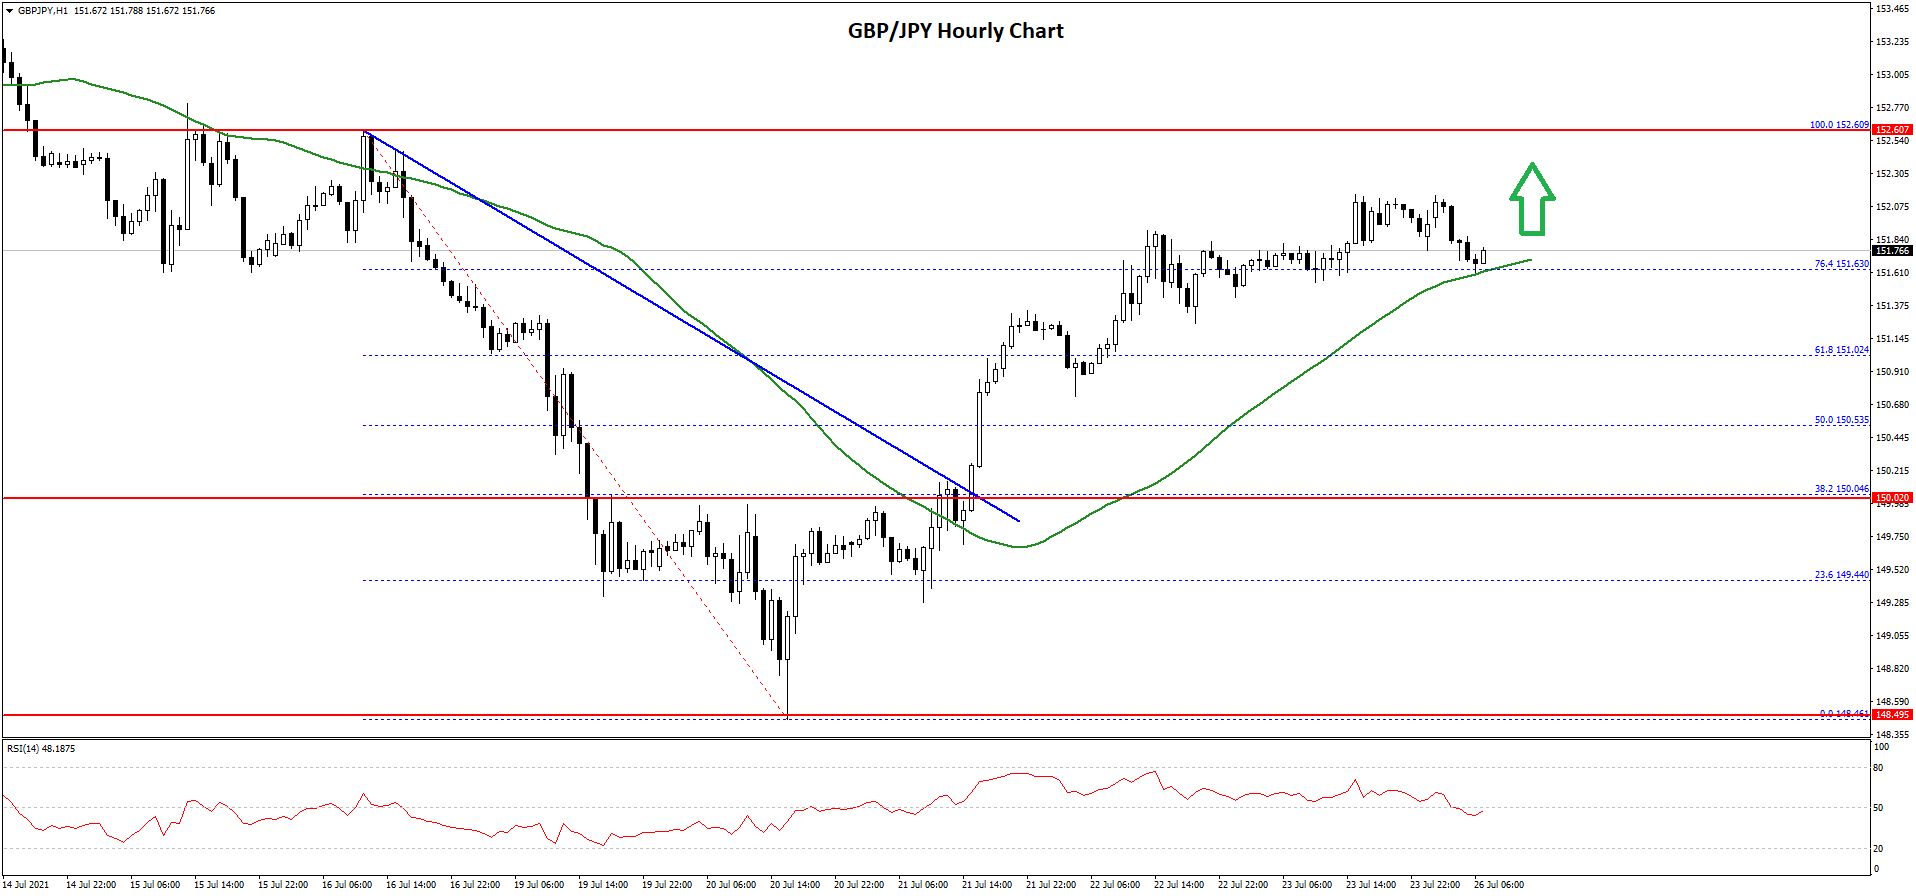
There was a clear break above the 61.8% Fib retracement level of the key downward move from the 152.60 high to 148.46 low. However, the bears protected the 152.20 zone.
It is now consolidating above the 76.4% Fib retracement level of the key downward move from the 152.60 high to 148.46 low. On the upside, the pair is facing a key hurdle near 152.50. A clear break above the 152.50 barrier could open the doors for a steady increase towards the 153.00 and 153.20 levels. The main resistance is still near the 154.00 level.
If there is a fresh decline, the pair could test the 151.00 support level. The next major support is near 150.60, below which the pair could test the 150.00 support zone.
This forecast represents FXOpen Markets Limited opinion only, it should not be construed as an offer, invitation or recommendation in respect to FXOpen Markets Limited products and services or as financial advice.
Trade over 50 forex markets 24 hours a day with FXOpen. Take advantage of low commissions, deep liquidity, and spreads from 0.0 pips (additional fees may apply). Open your FXOpen account now or learn more about trading forex with FXOpen.
This article represents the opinion of the Companies operating under the FXOpen brand only. It is not to be construed as an offer, solicitation, or recommendation with respect to products and services provided by the Companies operating under the FXOpen brand, nor is it to be considered financial advice.
Stay ahead of the market!
Subscribe now to our mailing list and receive the latest market news and insights delivered directly to your inbox.


Latest articles

EUR/USD and GBP/USD consolidate ahead of the Fed decision
European currencies are showing subdued dynamics, entering a consolidation phase following their previous advance. Earlier, EUR/USD and GBP/USD broke out of their ranges and strengthened; however, the subsequent correction has led both pairs to retest the previously breached

Meta: V-Shaped Recovery Meets Heavy Volume Resistance
The movement in Meta Platforms shares is being driven by two competing narratives. On one hand, advertising revenue is benefiting from AI-based tools: the Advantage+ platform continues to support strong advertiser demand, and the analyst consensus for Q1 2026 revenue

Commodity Currencies Test Key Levels Ahead of Major Macro Data
Commodity-linked currencies are trading near key levels, showing restrained price action as market participants adopt a wait-and-see approach. The fundamental backdrop is shaped by expectations surrounding the release of Australia’s inflation data and the Bank of Canada’s interest