


GBP/USD and GBP/JPY: British Pound Could Rise Further
FXOpen

GBP/USD started a fresh increase above the 1.2420 and 1.2440 resistance levels. GBP/JPY is also rising and it seems like there are chances of more upsides above 1.2500.
Important Takeaways for GBP/USD and GBP/JPY
- The British Pound found a strong support at 1.2250 and it started a fresh increase.
- There is a major breakout pattern forming with resistance near 1.2500 on the hourly chart of GBP/USD.
- GBP/JPY is trading with a positive bias above the 133.50 pivot level.
- There is a key bullish trend line forming with support near 133.90 on the hourly chart.
GBP/USD Technical Analysis
This past week, the British Pound extended its decline below the 1.2400 support zone against the US Dollar. The GBP/USD pair even traded below the 1.2300 level before it found support near 1.2250.
A base was formed above 1.2250 and recently the pair started a fresh increase. There was a break above the 1.2400 resistance level and the 50 hourly simple moving average. The bulls gained pace and the pair traded as high as 1.2529 on FXOpen.
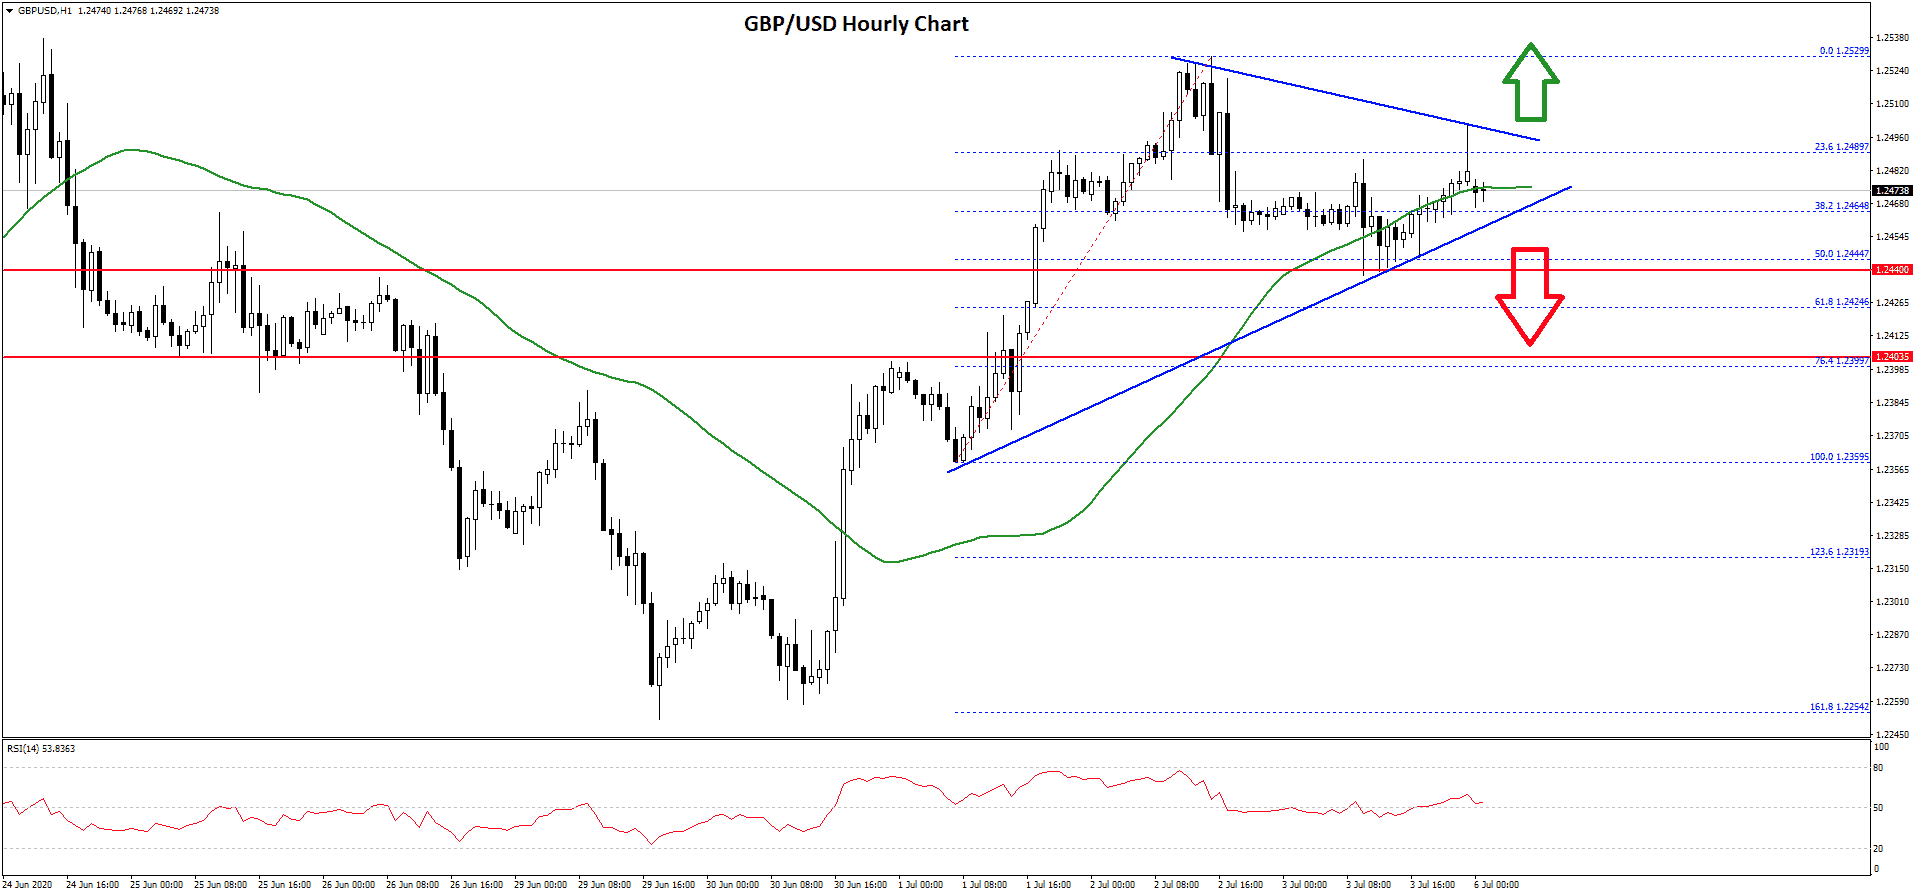
It is currently correcting lower and it broke the 1.2500 level. There was a break below the 23.6% Fib retracement level of the upward move from the 1.2359 low to 1.2529 high. However, the pair remained stable above the 1.2450 support.
The 50% Fib retracement level of the upward move from the 1.2359 low to 1.2529 high also provided support. It seems like there is a major breakout pattern forming with resistance near 1.2500 on the hourly chart of GBP/USD.
If the pair breaks the triangle resistance at 1.2500, it could continue to rise. The next resistance is near the 1.2530 level, above which the bulls might aim a break above the 1.2550 resistance.
Conversely, there is a risk of a downside break below the 1.2450 and 1.2440 support levels. In the mentioned case, the pair could decline towards the 1.2350 level in the near term.
GBP/JPY Technical Analysis
The British Pound also formed a strong support near the 132.00 level and started a strong increase against the Japanese Yen. The GBP/JPY pair broke the key 133.20 resistance level to move into a positive zone.
Besides, the pair settled above the 133.50 level and the 50 hourly simple moving average. The upward move was such that the pair traded as high as 134.70 before starting a downside correction.
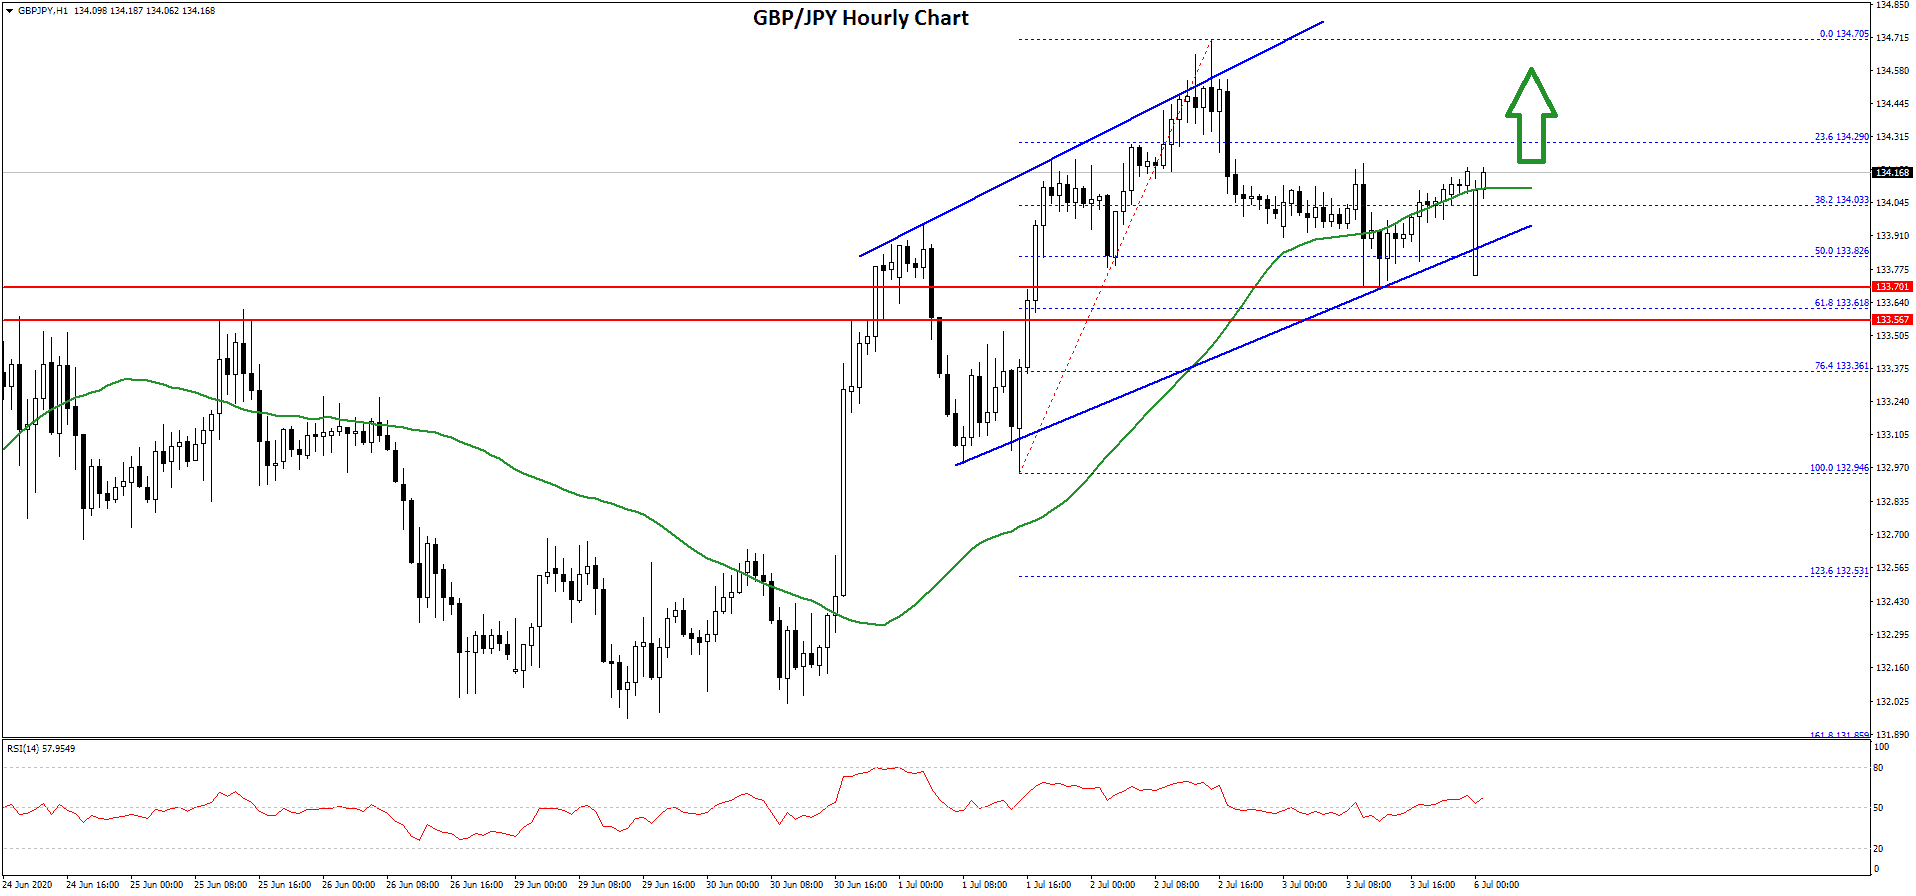
There was a break below the 134.20 level, and the 23.6% Fib retracement level of the upward move from the 132.94 low to 134.70 high. However, the pair is holding the 133.80 support level.
The 50% Fib retracement level of the upward move from the 132.94 low to 134.70 high is also acting as a support. More importantly, there is a key bullish trend line forming with support near 133.90 on the hourly chart.
Therefore, the pair is likely to continue higher above the 134.50 resistance level as long as it is above the trend line support. The next major resistance is near 134.70, above which the pair could surge above 135.00.
On the downside, the pair must stay above the 133.80 and 133.70 support levels. If not, GBP/JPY might dive towards the 133.20 level or even 132.80 in the near term.
Trade over 50 forex markets 24 hours a day with FXOpen. Take advantage of low commissions, deep liquidity, and spreads from 0.0 pips (additional fees may apply). Open your FXOpen account now or learn more about trading forex with FXOpen.
This article represents the opinion of the Companies operating under the FXOpen brand only. It is not to be construed as an offer, solicitation, or recommendation with respect to products and services provided by the Companies operating under the FXOpen brand, nor is it to be considered financial advice.
Stay ahead of the market!
Subscribe now to our mailing list and receive the latest market news and insights delivered directly to your inbox.


Latest articles

US Dollar Strengthens Amid Equity Market Weakness and Hawkish Fed Rhetoric
The US dollar continues to hold firm near multi-year highs as sentiment across equity markets deteriorates and investors increasingly expect the Federal Reserve to maintain a restrictive monetary policy stance for longer. The US economy remains resilient, while inflation risks

Bitcoin: Corrective Channel Broken as Traders Turn More Active
Bitcoin has come under the influence of several factors simultaneously. The wave of selling at the beginning of June was linked to Strategy's first disclosed Bitcoin sale in several years, a prolonged series of outflows from spot ETFs, and a

DAX 40: consolidation amid technology sell-off
A wave of selling in the technology sector that emerged earlier this week has weighed on European equities. The trigger was investor concern over the profitability of large-scale debt-funded investments by major US tech companies in AI infrastructure. The Nasdaq