


GBP/USD and GBP/JPY: British Pound Eyeing Further Upsides
FXOpen

GBP/USD started a fresh increase above the 1.3150 resistance zone. GBP/JPY is also showing positive signs and it could rise sharply if there is a clear break above 138.50.
Important Takeaways for GBP/USD and GBP/JPY
- The British Pound remained well bid above the 1.3100 support zone.
- There is a major bullish trend line forming with support near 1.3150 on the hourly chart of GBP/USD.
- GBP/JPY is also showing positive signs above the 137.50 and 137.40 support levels.
- There is a key bullish trend line forming with support near 138.00 on the hourly chart.
GBP/USD Technical Analysis
This past week, the British Pound gained momentum above the 1.3200 resistance against the US Dollar. The GBP/USD pair even broke the 1.3280 resistance, but it struggled to retain momentum above the 1.3300 level.
A high was formed near 1.3310 on FXOpen before the price started a downside correction. There was a break below the 1.3200 support zone and the 50 hourly simple moving average.
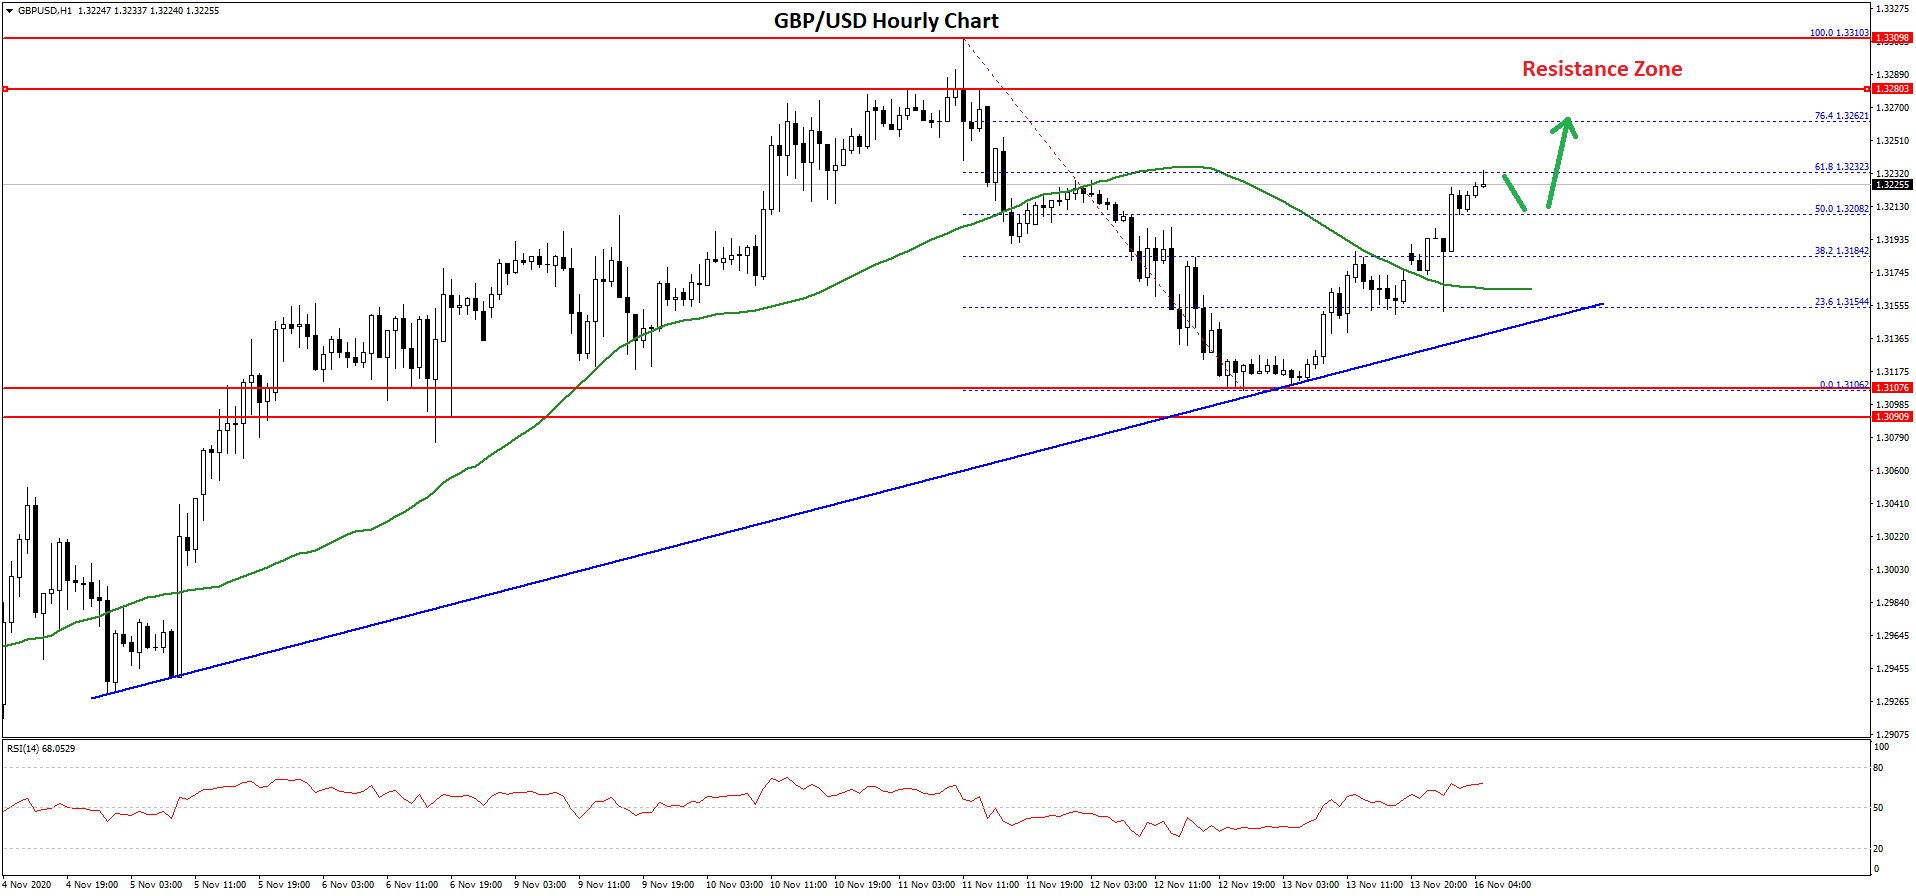
However, the bulls were able to protect the 1.3100 support zone. A low is formed near 1.3160 and the price is currently rising. There was a break above the 1.3150 and 1.3160 resistance levels. The pair even climbed above the 50% Fib retracement level of the downward move from the 1.3310 high to 1.3106 swing low.
There is also a major bullish trend line forming with support near 1.3150 on the hourly chart of GBP/USD. The pair is currently testing the 1.3235 resistance zone.
The 61.8% Fib retracement level of the downward move from the 1.3310 high to 1.3106 swing low is also near the 1.3233 level. A clear break above the 1.3235 and 1.3250 levels might open the doors for more upsides in the near term.
On the downside, the trend line is important near the 1.3150 level and the 50 hourly simple moving average. A close below the 1.3150 level might push the pair further lower towards the 1.3050 support.
GBP/JPY Technical Analysis
The British Pound also climbed higher towards the 140.00 resistance before correcting lower against the Japanese Yen. The GBP/JPY pair broke the 139.20 support level to start a downside correction.
There was a break below the 138.50 level and the 50 hourly simple moving average. However, the pair found support near the 137.50 zone and traded as low as 137.54. It is currently consolidating losses and trading above the 138.00 level.
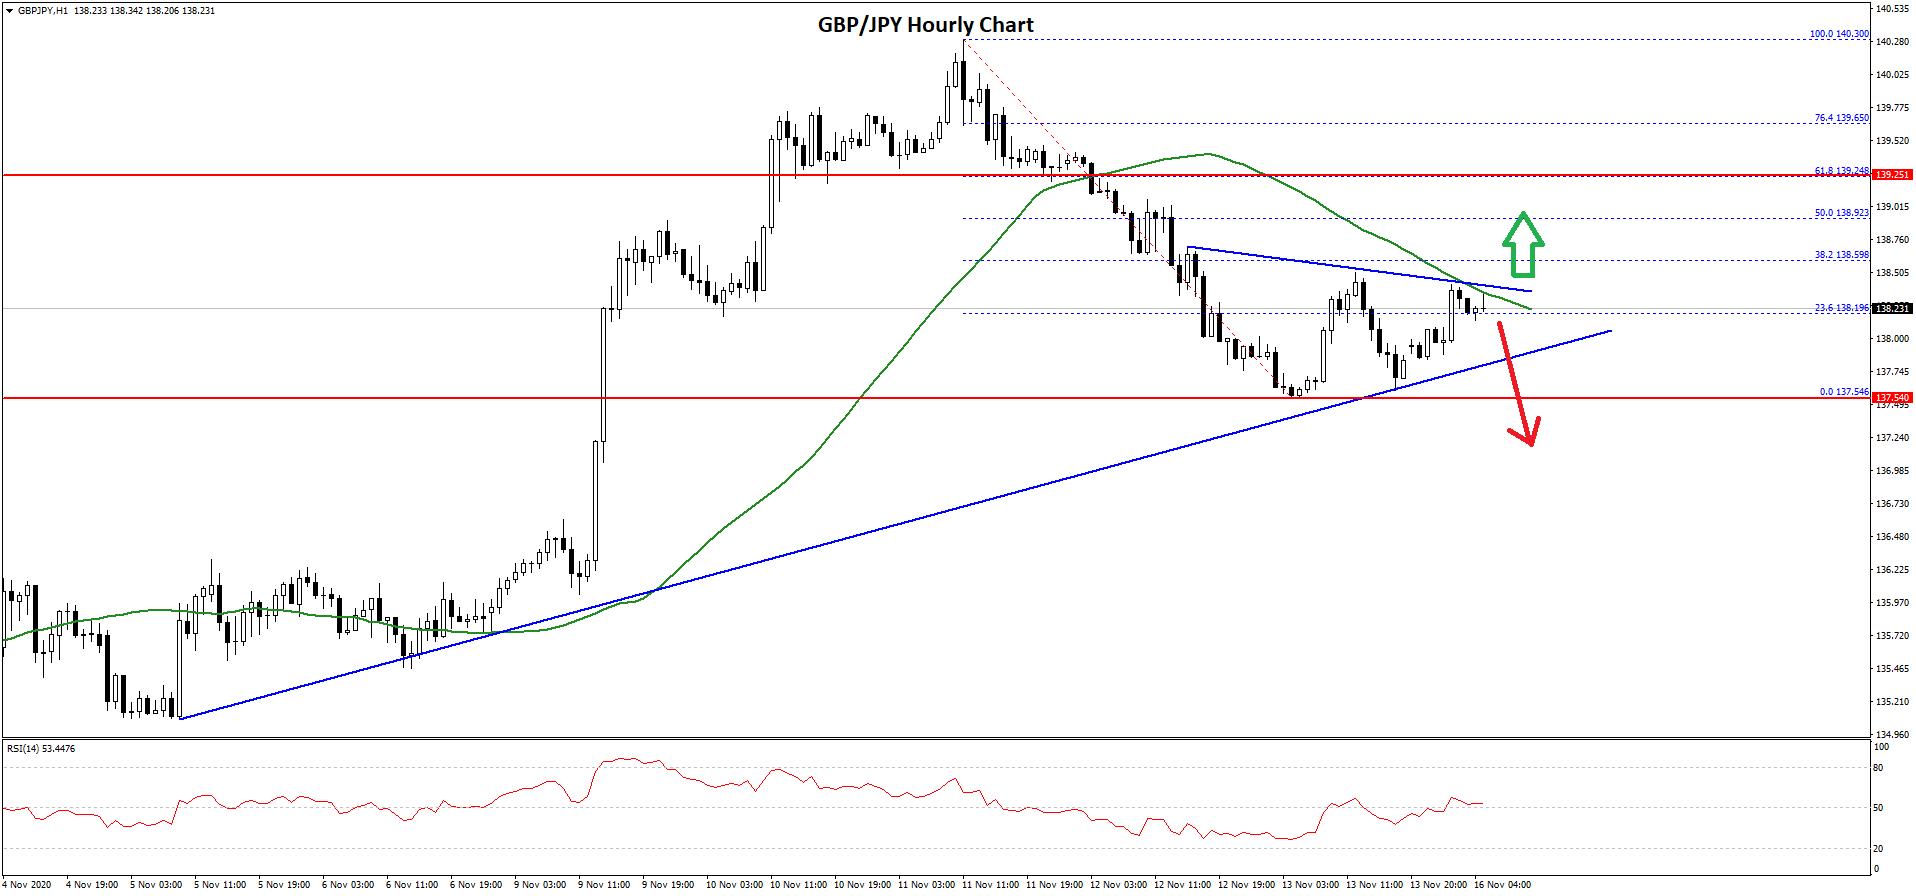
There was a break above the 23.6% Fib retracement level of the recent decline from the 140.30 high to 137.54 low. Moreover, there is a key bullish trend line forming with support near 138.00 on the hourly chart.
On the upside, there is a key barrier forming near a connecting bearish trend line and 138.50. A successful break above the 138.50 zone might push the pair towards the 139.00 resistance.
The 50% Fib retracement level of the recent decline from the 140.30 high to 137.54 low is at 138.92 to act as a resistance. The next major resistance is near 139.20, above which the pair could rally towards the 140.00 resistance.
Conversely, there might be a downside break below the 138.00 support level. The next major support is near the 137.50 zone. Any further losses could lead the pair towards the 136.50 level.
Trade over 50 forex markets 24 hours a day with FXOpen. Take advantage of low commissions, deep liquidity, and spreads from 0.0 pips (additional fees may apply). Open your FXOpen account now or learn more about trading forex with FXOpen.
This article represents the opinion of the Companies operating under the FXOpen brand only. It is not to be construed as an offer, solicitation, or recommendation with respect to products and services provided by the Companies operating under the FXOpen brand, nor is it to be considered financial advice.
Stay ahead of the market!
Subscribe now to our mailing list and receive the latest market news and insights delivered directly to your inbox.


Latest articles

EUR/USD Eyes Gains As USD/CHF Weakness Deepens Again
EUR/USD started a fresh increase above 1.1700 and 1.1720. USD/CHF declined further and is now struggling below 0.7835.
Important Takeaways for EUR/USD and USD/CHF Analysis Today
· The Euro started a decent increase from

Apple: Earnings Day Above the Activity Zone
On 30 April, after the market close, Apple Inc. will release its financial results for the second quarter of fiscal 2026. The consensus forecast, based on estimates from 31 analysts, points to revenue of around $109.7 billion, with expected

USD/JPY and USD/CHF Near Key Levels: The Dollar Supported by the Fed
The US dollar continues to trend upwards following the Federal Reserve meeting, drawing support from the regulator’s moderately hawkish stance and comments by Jerome Powell. Markets interpret the Fed’s rhetoric as a signal that restrictive policy is likely