


GBP/USD and GBP/JPY: British Pound Remains At Risk
FXOpen

GBP/USD failed to continue above 1.3150 and started a fresh decline below the 1.3100 support. GBP/JPY is also under pressure and it is likely to continue lower below 142.00.
Important Takeaways for GBP/USD and GBP/JPY
- The British Pound failed to continue above the 1.3150 and 1.3165 resistance levels.
- There was a break below a major bullish trend line with support near 1.3085 on the hourly chart of GBP/USD.
- GBP/JPY declined heavily and broke many supports near the 143.00 and 142.80 levels.
- There was a break below a key contracting triangle with support near 143.35 on the hourly chart.
GBP/USD Technical Analysis
This past week, there was a decent rise in the British Pound above the 1.3060 and 1.3100 resistance levels against the US Dollar. However, the GBP/USD pair struggled to stay above the 1.3150 resistance area.
A high was formed near 1.3172 on FXOpen and recently there was a fresh decline. The pair declined below the 1.3120 and 1.3100 support levels.
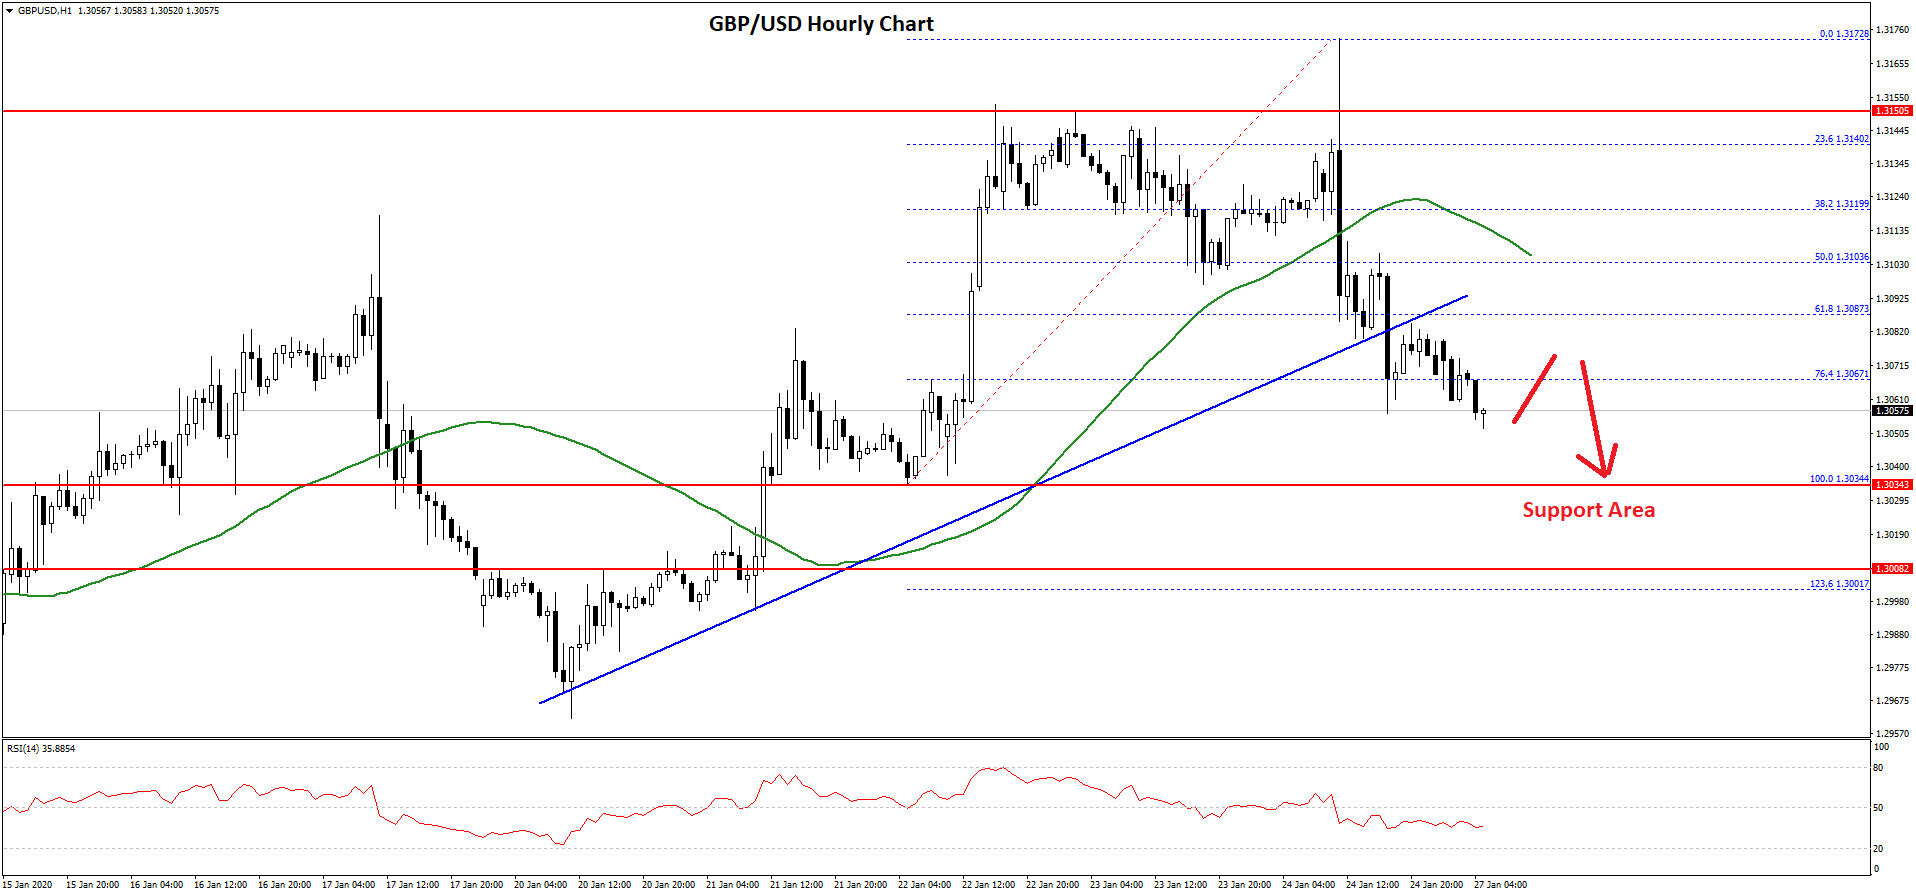
Moreover, there was a break below a major bullish trend line with support near 1.3085 on the hourly chart of GBP/USD. The pair even broke the 50% Fib retracement level of the upward move from the 1.3034 low to 1.3172 high.
It is now trading below the 1.3080 level and the 50 hourly simple moving average. Besides, it is currently below the 76.4% Fib retracement level of the upward move from the 1.3034 low to 1.3172 high.
Therefore, there is a risk of more downsides below the 1.3050 level in the near term. An initial support is near the 1.3035 level, below which the pair could even test the 1.3000 support area.
On the upside, an initial resistance is near the 1.3080 level. However, the GBP/USD pair must surpass the 1.3100 resistance area and the 50 hourly SMA to move into a positive zone.
A successful close above 1.3100 could lead the pair towards the 1.3150 resistance. If not, the pair is likely to revisit the 1.3000 zone.
GBP/JPY Technical Analysis
The British Pound started a major decline from well above the 144.00 level against the Japanese Yen. The GBP/JPY pair broke a few important supports near 143.50 level to move into a bearish zone.
During the decline, there was a break below a key contracting triangle with support near 143.35 on the hourly chart. The pair settled below the 143.20 level and recently declined towards 142.00.
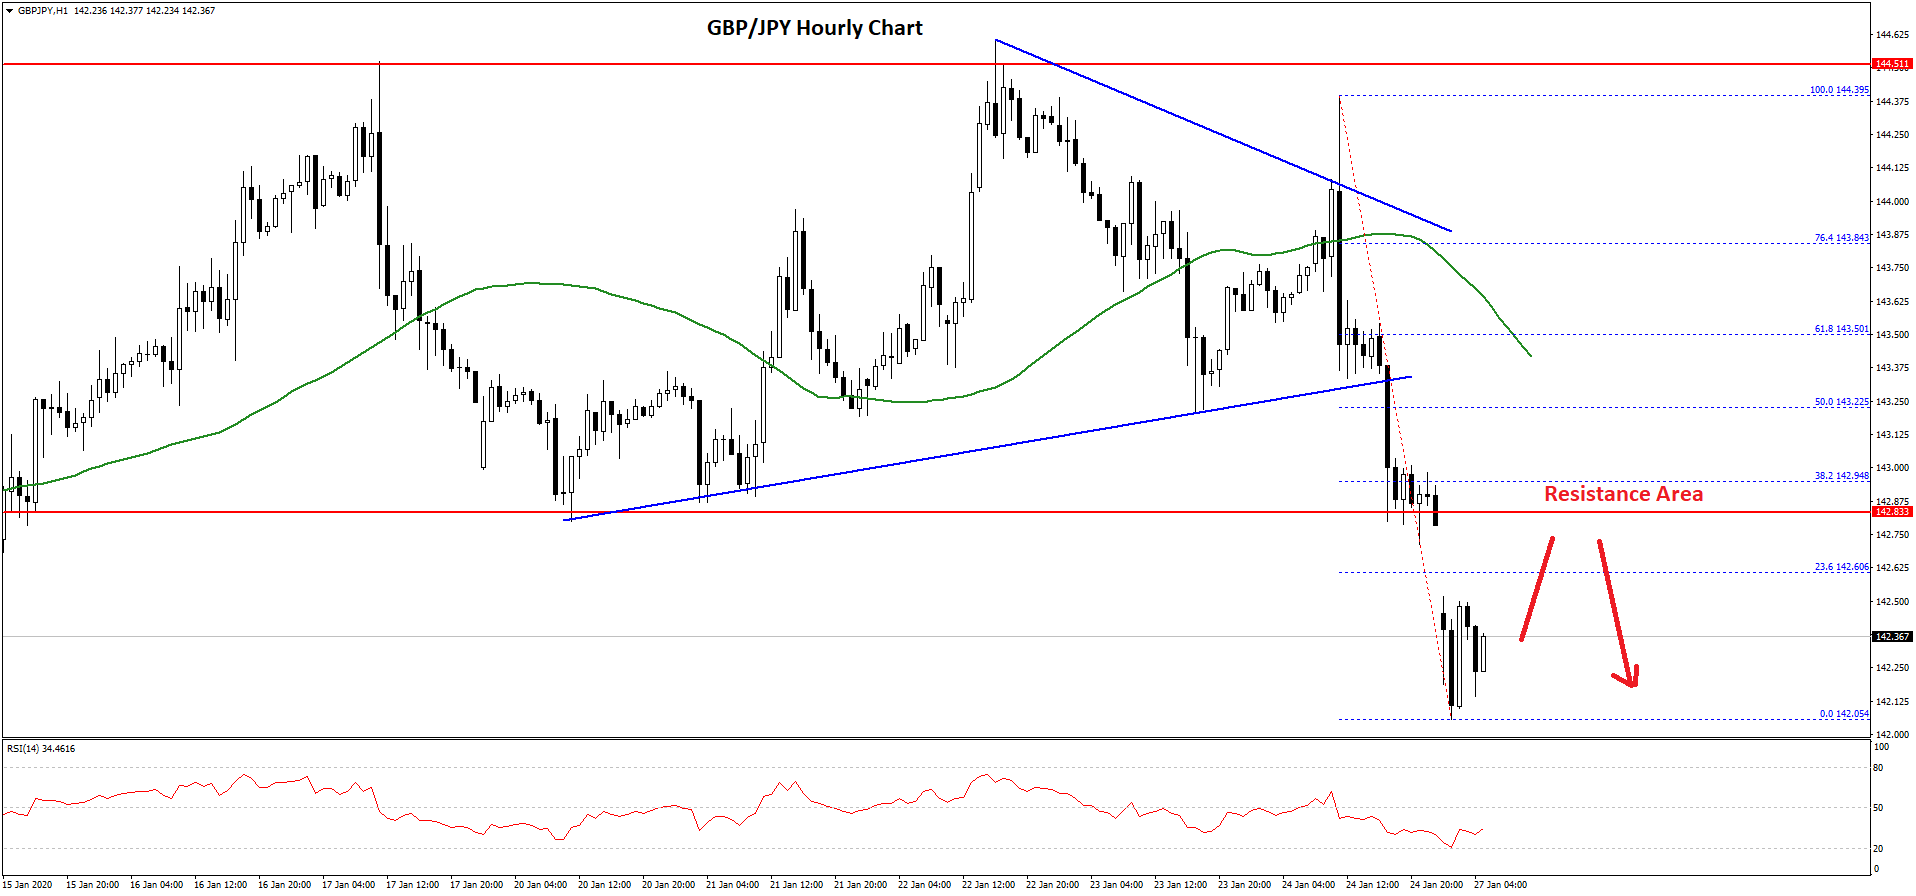
A low is formed near the 142.05 level. The pair is currently correcting higher above the 142.30 level. An initial resistance is near the 23.6% Fib retracement level of the recent decline from the 144.39 high to 142.05 low.
It seems like the GBP/JPY pair might correct higher towards the 142.80 resistance area to fill the opening week gap. Any further gains could be contained by the 50% Fib retracement level of the recent decline from the 144.39 high to 142.05 low.
Once the current correction is complete, the pair is likely to continue lower below 142.20 level in the near term.
On the downside, the key support is near the 142.00 area. If GBP/JPY slides below the 142.00 support, there is a risk of a larger decline towards the 141.00 and 140.50 levels.
Trade over 50 forex markets 24 hours a day with FXOpen. Take advantage of low commissions, deep liquidity, and spreads from 0.0 pips (additional fees may apply). Open your FXOpen account now or learn more about trading forex with FXOpen.
This article represents the opinion of the Companies operating under the FXOpen brand only. It is not to be construed as an offer, solicitation, or recommendation with respect to products and services provided by the Companies operating under the FXOpen brand, nor is it to be considered financial advice.
Stay ahead of the market!
Subscribe now to our mailing list and receive the latest market news and insights delivered directly to your inbox.


Latest articles

EUR/USD Eyes Gains As USD/CHF Weakness Deepens Again
EUR/USD started a fresh increase above 1.1700 and 1.1720. USD/CHF declined further and is now struggling below 0.7835.
Important Takeaways for EUR/USD and USD/CHF Analysis Today
· The Euro started a decent increase from

Apple: Earnings Day Above the Activity Zone
On 30 April, after the market close, Apple Inc. will release its financial results for the second quarter of fiscal 2026. The consensus forecast, based on estimates from 31 analysts, points to revenue of around $109.7 billion, with expected

USD/JPY and USD/CHF Near Key Levels: The Dollar Supported by the Fed
The US dollar continues to trend upwards following the Federal Reserve meeting, drawing support from the regulator’s moderately hawkish stance and comments by Jerome Powell. Markets interpret the Fed’s rhetoric as a signal that restrictive policy is likely