


GBP/USD and GBP/JPY Could Resume Increase
FXOpen
GBP/USD is consolidating gains pace above the 1.2350 zone. GBP/JPY is also rising and might gain pace if it clears the 161.80 resistance zone.
Important Takeaways for GBP/USD and GBP/JPY
· The British Pound is showing positive signs above 1.2350 against the US Dollar.
· There is a key contracting triangle forming with resistance near 1.2400 on the hourly chart of GBP/USD.
· GBP/JPY started a fresh increase above the 160.00 resistance zone.
· There is a major bullish trend line forming with support near 160.90 on the hourly chart.
GBP/USD Technical Analysis
This past week, the British Pound found support near the 1.2280 zone against the US Dollar. The GBP/USD pair formed a base and started a steady increase above the 1.23200 level.
There was a clear move above the 1.2350 resistance and the 50 hourly simple moving average. The pair even cleared the 1.2400 resistance. A high is formed near 1.2418 on FXOpen and the pair corrected lower.
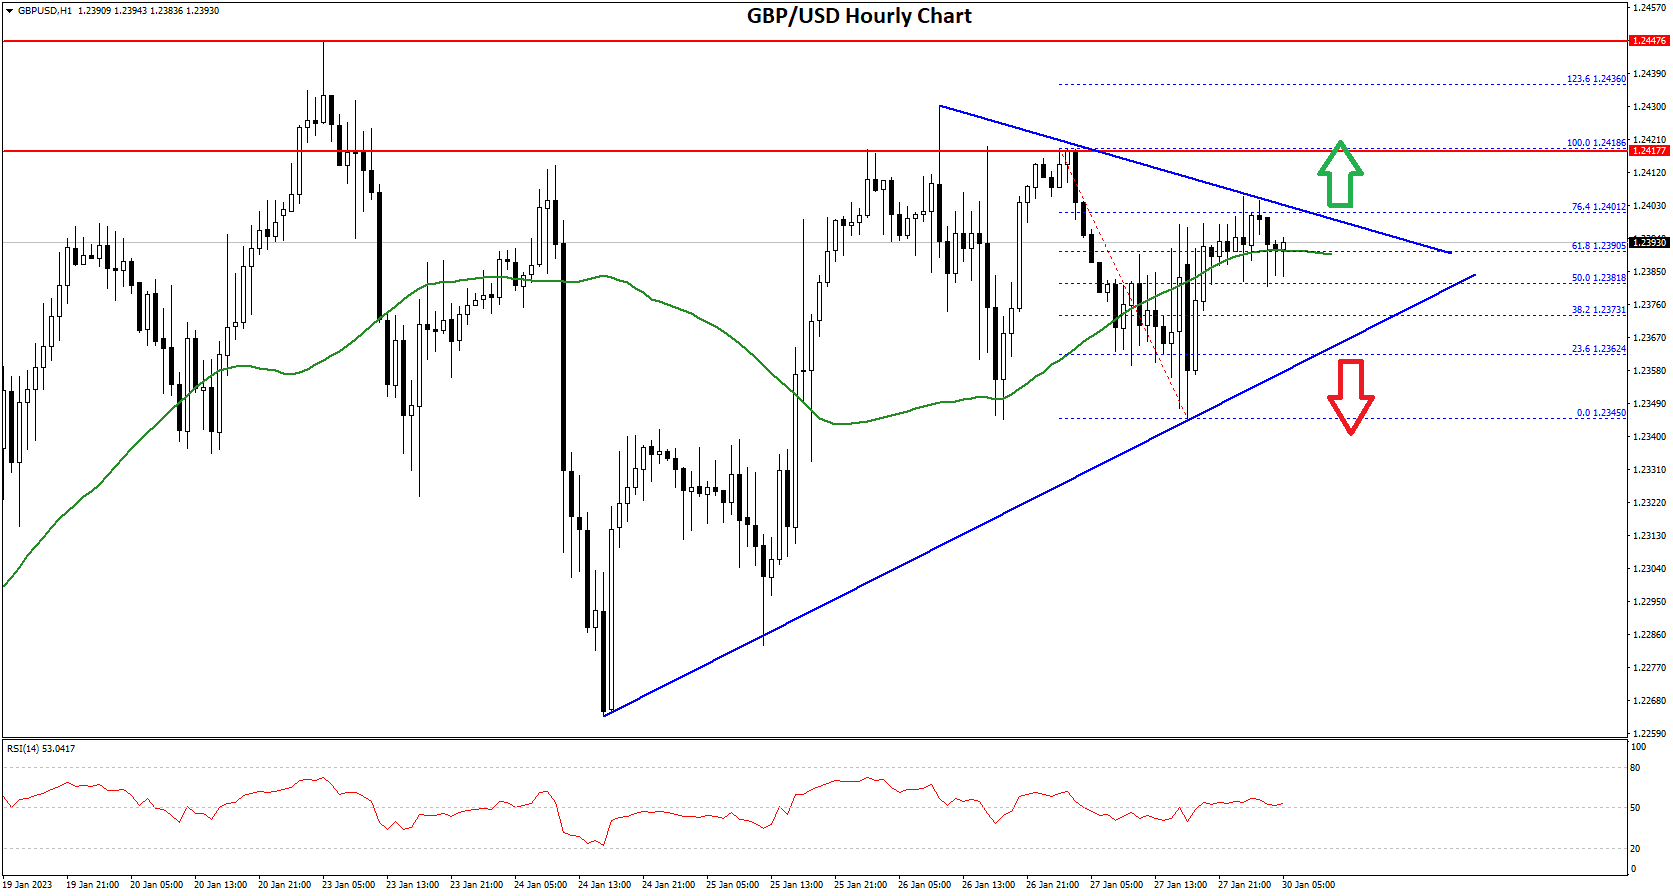
There was a move below the 1.2380 level, but the bulls were active near the 1.2345. The pair is now rising and trading above the 50% Fib retracement level of the recent decline from the 1.2418 swing high to 1.2345 low.
An immediate resistance on the upside is near the 1.2400 level. There is also a key contracting triangle forming with resistance near 1.2400 on the hourly chart of GBP/USD.
The triangle resistance is near the 76.4% key contracting triangle forming with resistance near 1.2400 on the hourly chart of GBP/USD. The next major resistance is near the 1.2420 level, above which the pair could start a steady increase towards 1.2450.
An upside break above 1.2450 might start a fresh increase towards 1.2550. Any more gains might call for a move towards 1.2600 or even 1.2640.
An immediate support is near the 1.2380. The next major support is near the 1.2350 level. If there is a break below the 1.2350 support, the pair could test the 1.2280 support. Any more losses might send GBP/USD towards 1.2220.
GBP/JPY Technical Analysis
The British Pound started a fresh increase from the 160.00 zone against the Japanese Yen. The GBP/JPY pair gained pace for a move above the 160.50 and 161.20 resistance levels.
There was also a close above the 161.00 level and the 50 hourly simple moving average. The pair traded as high as 161.73 before there was a downside correction. The pair traded below the 161.00 level and traded as low as 160.40.
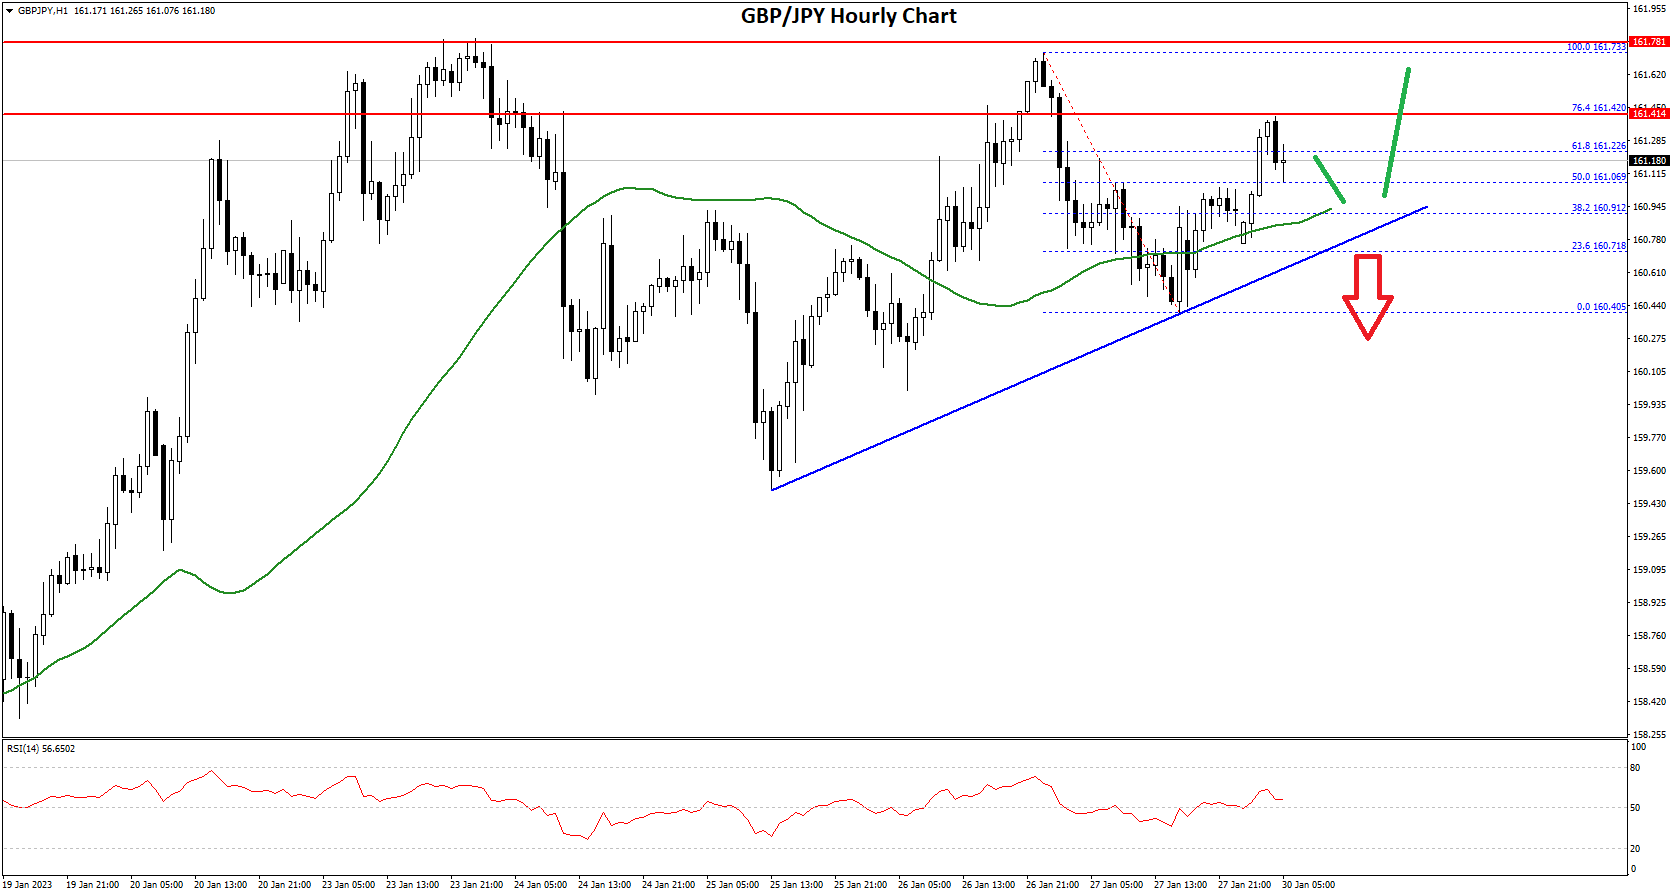
It is now rising and trading above the 50% Fib retracement level of the recent decline from the 161.73 swing high to 160.40 low.
An immediate resistance on the upside is near the 161.40 zone. It is near the 76.4% Fib retracement level of the recent decline from the 161.73 swing high to 160.40 low. The next key resistance could be 161.75.
A clear break above the 161.75 resistance could push the pair towards the 162.50 resistance. If not, the pair might decline below the 161.00 level.
On the downside, an initial support is near the 160.90 level. There is also a major bullish trend line forming with support near 160.90 on the hourly chart. The next major support is near the 160.40. If there is a downside break below the 160.40 support, the pair could decline towards the 160.00 support zone in the coming sessions. Any more losses might call for a test of the 159.50 support zone.
This forecast represents FXOpen Companies opinion only, it should not be construed as an offer, invitation or recommendation in respect to FXOpen Companies products and services or as financial advice.
Trade over 50 forex markets 24 hours a day with FXOpen. Take advantage of low commissions, deep liquidity, and spreads from 0.0 pips (additional fees may apply). Open your FXOpen account now or learn more about trading forex with FXOpen.
This article represents the opinion of the Companies operating under the FXOpen brand only. It is not to be construed as an offer, solicitation, or recommendation with respect to products and services provided by the Companies operating under the FXOpen brand, nor is it to be considered financial advice.
Stay ahead of the market!
Subscribe now to our mailing list and receive the latest market news and insights delivered directly to your inbox.


Latest articles

AI Valuations Are Back in the Spotlight
Artificial intelligence remains the dominant investment theme of 2026, but investors are increasingly questioning whether AI stock valuations are keeping pace with reality.
💰 Big Tech continues to invest at an unprecedented scale, with hyperscaler AI spending projected to exceed $800

AUD/CAD: Months of Indecision — Is a Breakout Finally Coming?
The Australian dollar has clawed back most of its end-of-June losses, when it touched three-month lows against the greenback amid escalating Middle East tensions. Since then, sentiment has improved: the RBA's Assistant Governor Sarah Hunter signalled the board stands ready

USD/JPY: Battling at the Top of the Triangle
On 3 July, Japan's Finance Minister, Satsuki Katayama, stated that the Ministry of Finance remains in close contact with US authorities regarding developments in USD/JPY as the yen traded near its weakest level in almost 40 years. Similar verbal