


GBP/USD and GBP/JPY Eye Upside Continuation
FXOpen
GBP/USD started a fresh increase from the 1.3500 zone and climbed above 1.3600. GBP/JPY is also rising, but it is facing resistance near 156.60.
Important Takeaways for GBP/USD and GBP/JPY
· The British Pound started a fresh increase above the 1.3500 and 1.3600 resistance levels against the US Dollar.
· There is a major bullish trend line forming with support near 1.3645 on the hourly chart of GBP/USD.
· GBP/JPY also started a steady increase above the 156.00 and 156.20 resistance levels.
· There is a key bearish trend line forming with resistance near 156.65 on the hourly chart.
GBP/USD Technical Analysis
After a major decline, the British Pound found support near the 1.3500 zone against the US Dollar. The GBP/USD pair started a fresh increase above the 1.3550 and 1.3600 resistance levels to move into a positive zone.
There was also a break above the 1.3680 zone and the 50 hourly simple moving average. It traded as high as 1.3748on FXOpen and is currently correcting gains.
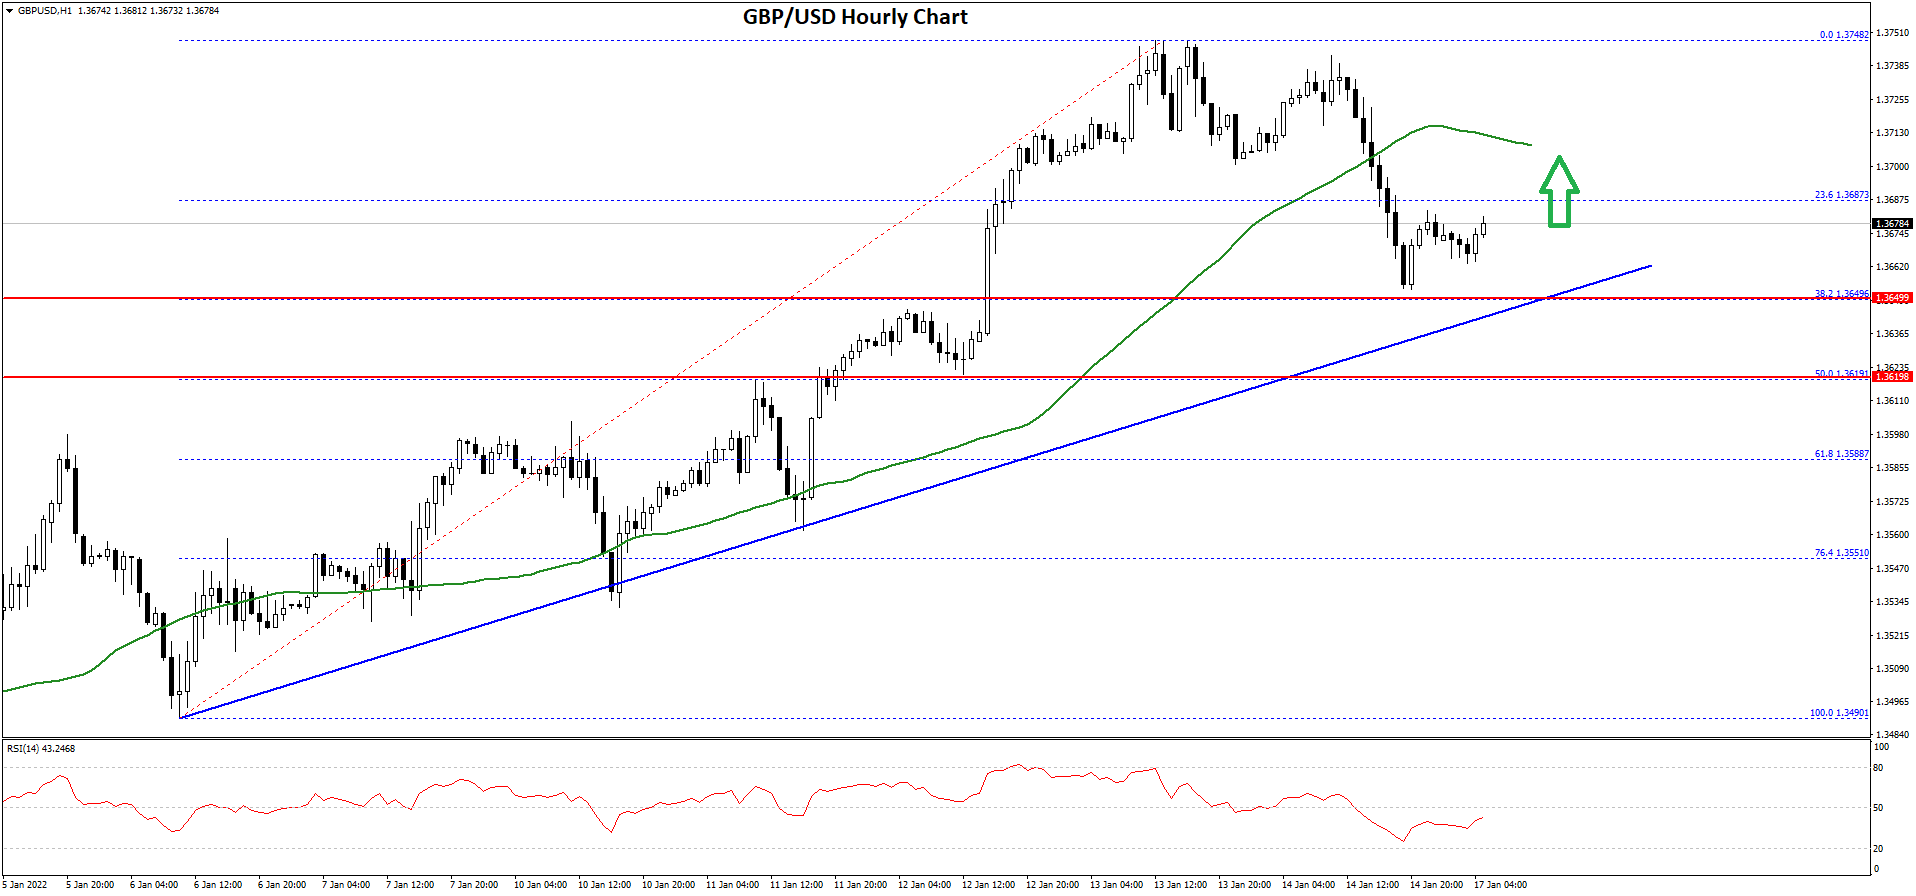
There was a minor decline below the 1.3720 level. The pair traded below the 23.6% Fib retracement level of the upward move from the 1.3490 swing low to 1.3748 high. On the downside, an immediate support is near the 1.3680 level.
There is also a major bullish trend line forming with support near 1.3645 on the hourly chart of GBP/USD. The next major support is near the 1.3620 level.
The 50% Fib retracement level of the upward move from the 1.3490 swing low to 1.3748 high is also near the 1.3620 zone. If there is a break below the 1.3620 support, the pair could test the 1.3550 support. If there are additional losses, the pair could decline towards the 1.3500 level.
On the upside, the pair is facing resistance near the 1.3720 level. A close above the 1.3720 level could open the doors for more gains. The next major hurdle is near 1.3750, above which the pair could surge towards 1.3850.
GBP/JPY Technical Analysis
The British Pound also started a decent increase from the 155.50 support zone against the Japanese Yen. The GBP/JPY pair broke the 156.00 resistance zone to enter a positive zone.
There was a clear move above the 38.2% Fib retracement level of the downward move from the 157.70 swing high to 155.45 low. It is now facing resistance near the 156.50 level and the 50 hourly simple moving average.
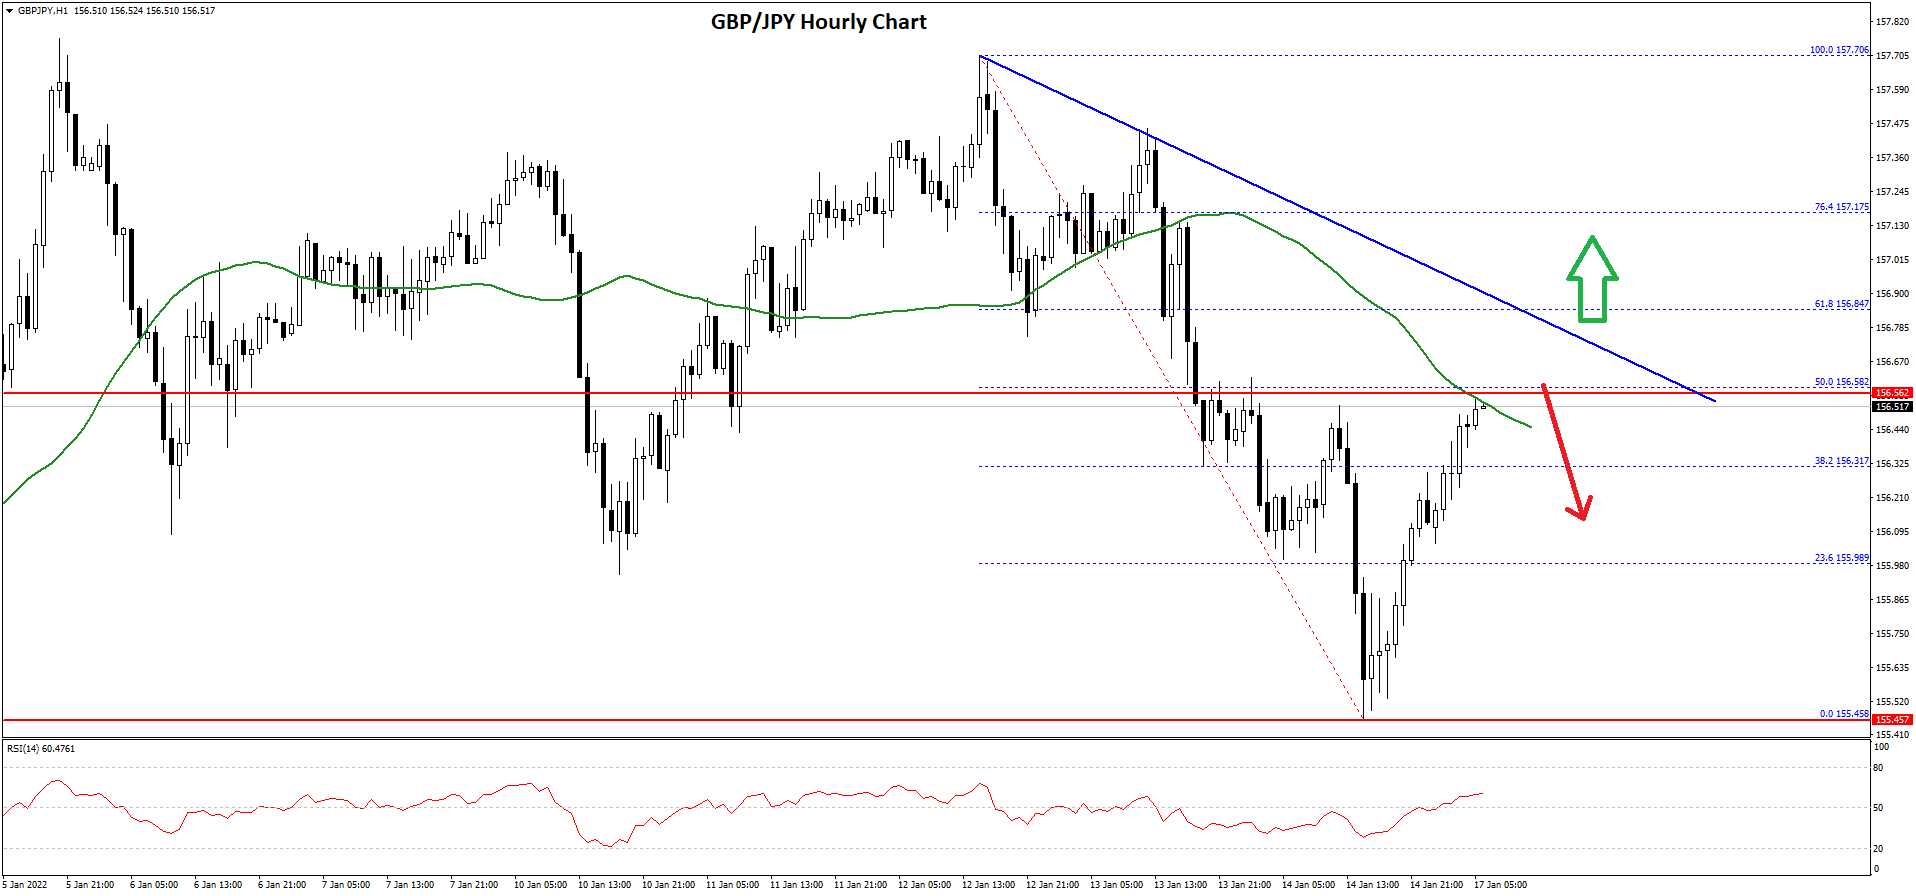
The 50% Fib retracement level of the downward move from the 157.70 swing high to 155.45 low is acting as a resistance. There is also a key bearish trend line forming with resistance near 156.65 on the hourly chart.
The next key resistance could be 156.80. A clear break above the 156.80 resistance could push the pair towards the 157.50 resistance.
On the downside, an initial support is near the 156.20 level. The next major support is near the 156.00 level. If there is a downside break below the 156.00 support, the pair could decline towards the 155.50 support zone. Any more losses might send the pair towards the 155.00 level in the near term.
This forecast represents FXOpen Markets Limited opinion only, it should not be construed as an offer, invitation or recommendation in respect to FXOpen Markets Limited products and services or as financial advice.
Trade over 50 forex markets 24 hours a day with FXOpen. Take advantage of low commissions, deep liquidity, and spreads from 0.0 pips (additional fees may apply). Open your FXOpen account now or learn more about trading forex with FXOpen.
This article represents the opinion of the Companies operating under the FXOpen brand only. It is not to be construed as an offer, solicitation, or recommendation with respect to products and services provided by the Companies operating under the FXOpen brand, nor is it to be considered financial advice.
Stay ahead of the market!
Subscribe now to our mailing list and receive the latest market news and insights delivered directly to your inbox.


Latest articles

Market Analysis: EUR/USD Revisits Support While USD/JPY Eyes Bigger Recovery Move
EUR/USD declined from 1.1800 and traded below 1.1750. USD/JPY is rising and might gain pace above 158.00 and 158.80.
Important Takeaways for EUR/USD and USD/JPY Analysis Today
· The Euro started a fresh

Dollar Gains After CPI: USD/JPY and USD/CAD Test Resistance
The US dollar strengthened following the release of stronger-than-expected inflation data, which reinforced expectations that the Federal Reserve will maintain a restrictive monetary policy stance. US consumer prices rose to their highest levels since May 2023, renewing concerns over persistent

XRP/USD: Consolidation Amid Regulatory Expectations
Fundamental Background
The key event for XRP in May remains the fate of the CLARITY Act, which is expected to establish XRP’s status as a digital commodity at the federal level. According to CoinMarketCap, the Senate Banking Committee has