


GBP/USD and USD/CAD Buyers In Full Control
FXOpen
GBP/USD rallied recently and broke the 1.3100 and 1.3250 resistance levels. USD/CAD traded above the key 1.3240 resistance to start a solid uptrend in the near term.
Important Takeaways for GBP/USD and USD/CAD
- The British Pound climbed above the 1.3300 level before sellers appeared near the 1.3350 level.
- There is a major bearish trend line formed with resistance at 1.3260 on the hourly chart of GBP/USD.
- USD/CAD rallied above the key 1.3240 resistance area to move into a positive zone.
- There was a break above a major triangle pattern with resistance at 1.3195 on the hourly chart.
GBP/USD Technical Analysis
The British Pound started a solid upward move this past week from the 1.3000 support area against the US Dollar. The GBP/USD pair rallied above the 1.3100 and 1.3200 resistance levels to move into a bullish zone.
The upward move was strong as the pair even broke the 1.3250 resistance and the 50 hourly simple moving average. Finally, buyers gained momentum above the 1.3300 level and a new monthly high was formed at 1.3349 on FXOpen.
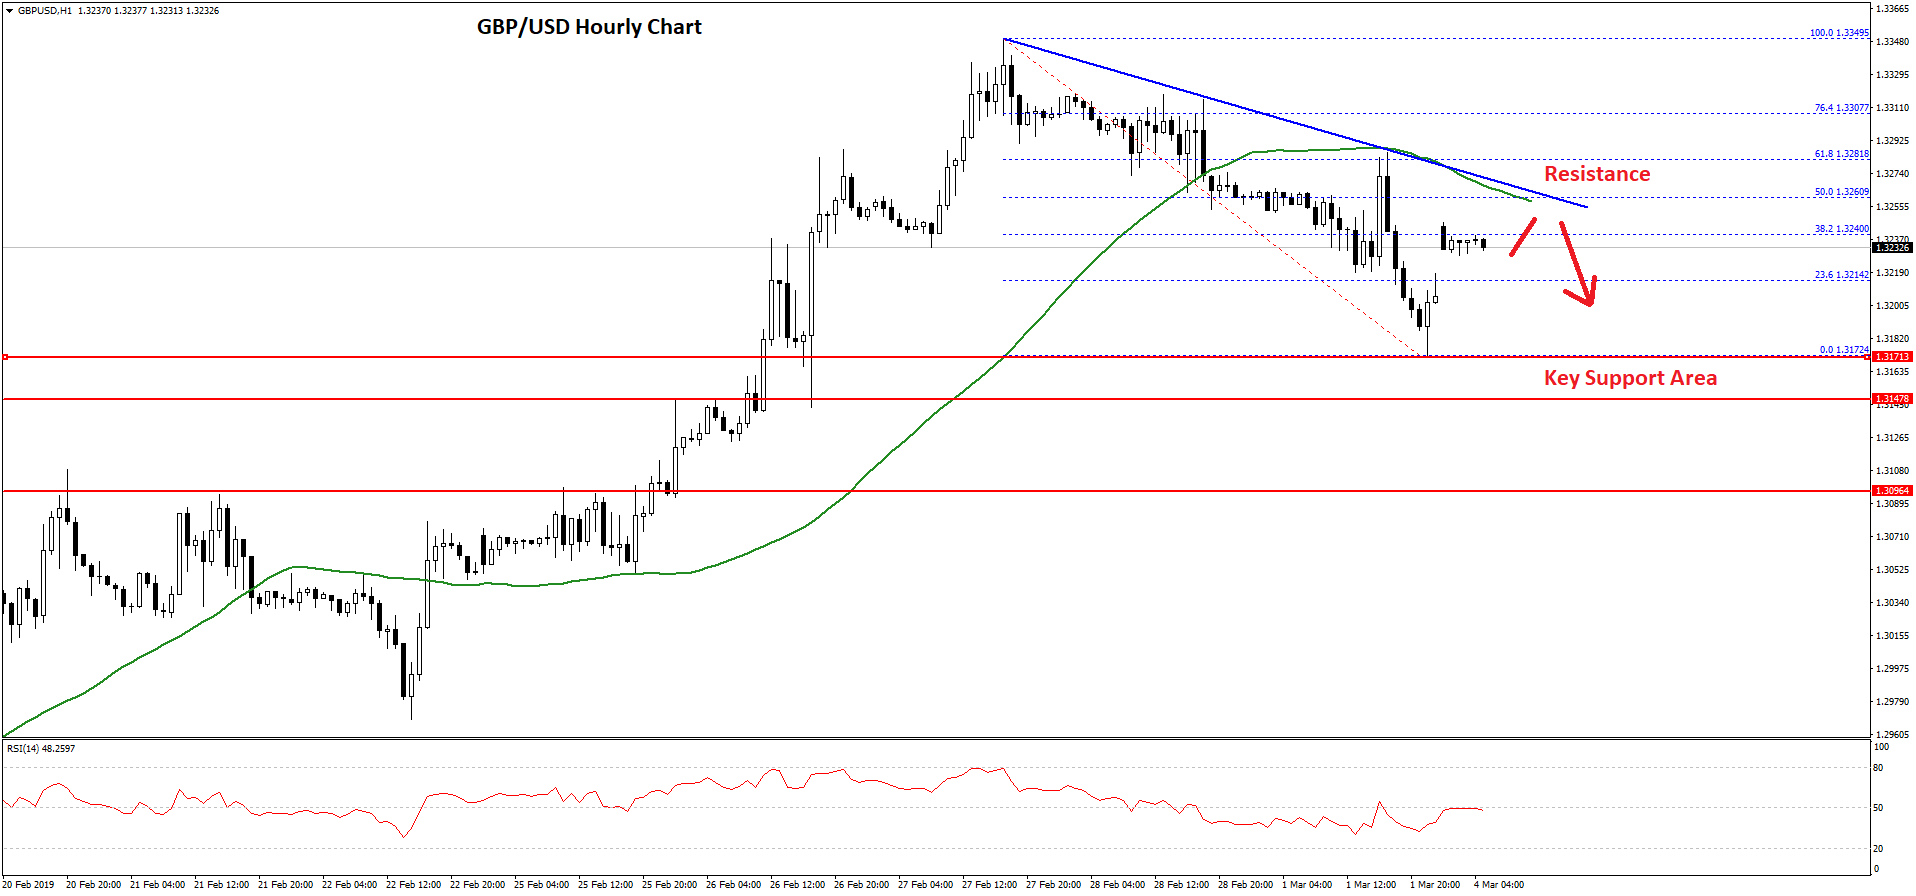
Later, the pair started a downside correction and traded below the 1.3300 support area. There was a break below the 1.3200 support as well before buyers appeared near the 1.3175 level.
The pair bounced back after trading as low as 1.3172, but it is still trading well below the 50 hourly simple moving average. At the moment, the pair is testing the 38.2% Fib retracement level of the last decline from the 1.3349 high to 1.3172 low.
However, there is a strong resistance formed near the 1.3260 level and the 50 hourly simple moving average. There is also a major bearish trend line formed with resistance at 1.3260 on the hourly chart of GBP/USD.
The trend line coincides with the 50% Fib retracement level of the last decline from the 1.3349 high to 1.3172 low. Therefore, the pair is likely to struggle near the 1.3260 resistance area.
In the short term, there could be another dip in GBP/USD towards the 1.3140 support area before the pair climbs back above the 1.3250, 1.3260 and 1.3300 resistance levels.
USD/CAD Technical Analysis
The US Dollar formed a solid support base near the 1.3120 level and later climbed higher against the Canadian Dollar. The USD/CAD pair broke the 1.3180 and 1.3200 resistance levels to move into a positive zone.
More importantly, there was a break above a major triangle pattern with resistance at 1.3195 on the hourly chart. Finally, the pair broke the key 1.3240 resistance area to move into a positive zone.
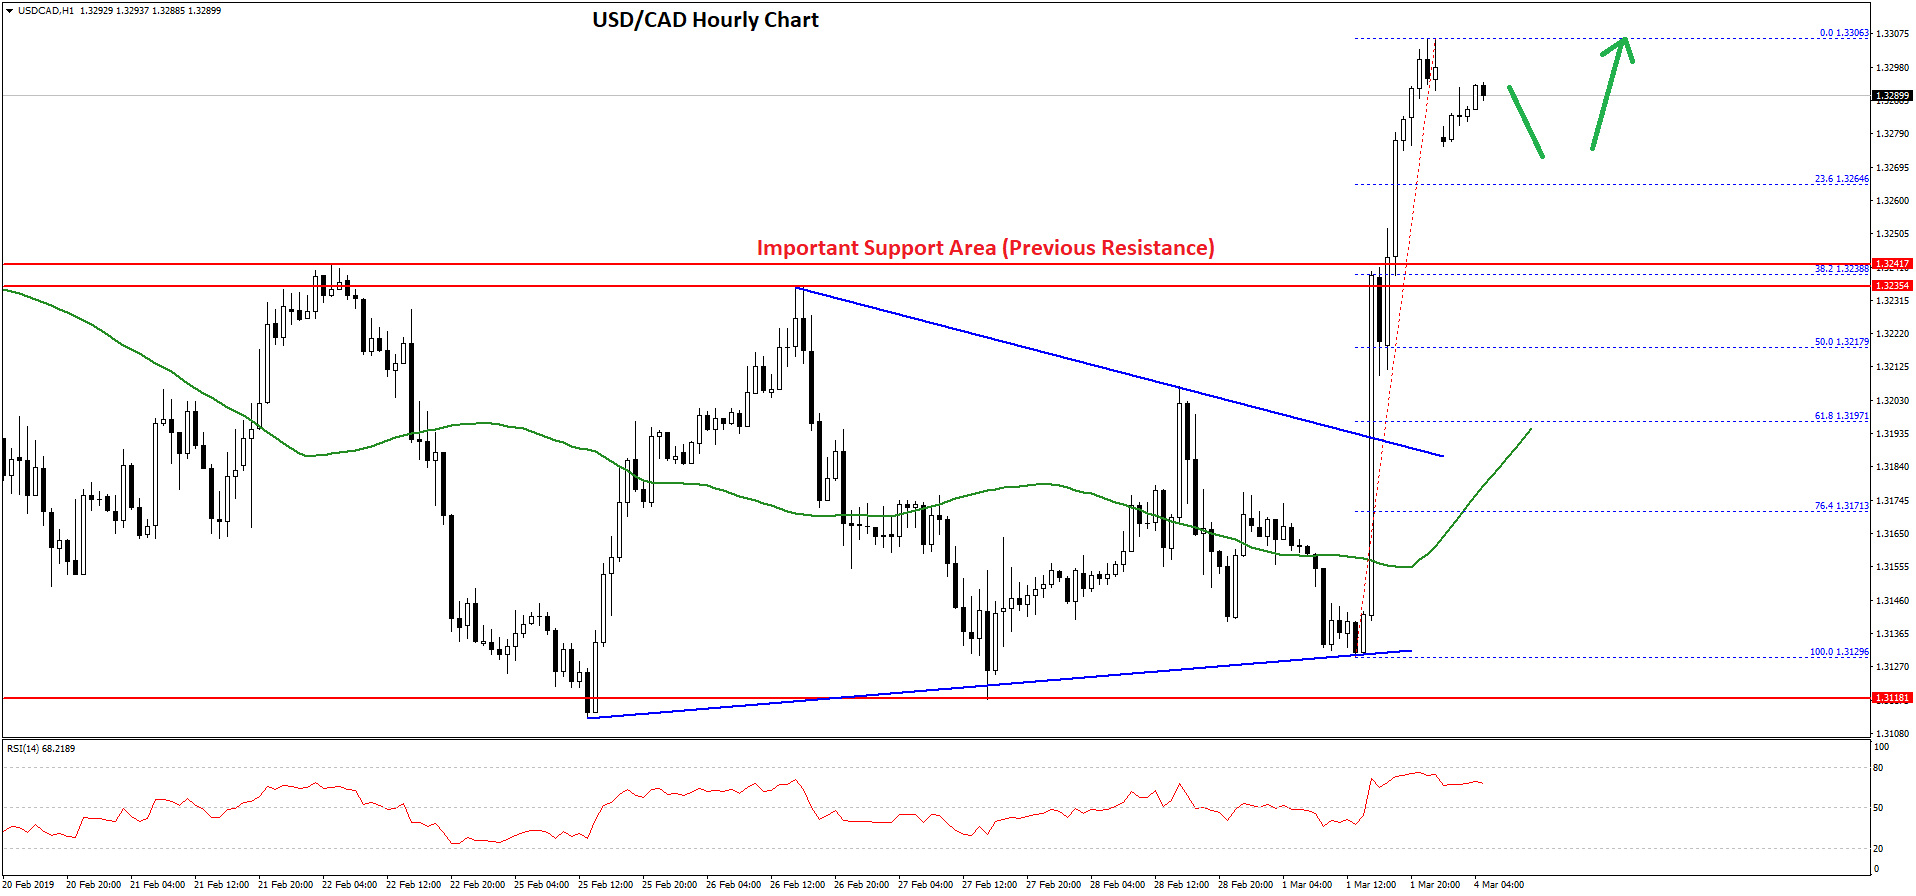
The pair settled above the 1.3250 level and the 50 hourly simple moving average. It traded as high as 1.3306 and currently correcting lower. An initial support is at 1.3265 and the 23.6% Fib retracement level of the last wave from the 1.3129 low to 1.3306 high.
However, the main support is near the 1.3240 level and the 38.2% Fib retracement level of the last wave from the 1.3129 low to 1.3306 high.
Therefore, if USD/CAD declines or corrects lower, it is likely to find a strong buying interest near the 1.3265 and 1.3240 levels. On the upside, a break above the 1.3300 area may push the pair towards the 1.3320 and 1.3340 levels.
Trade over 50 forex markets 24 hours a day with FXOpen. Take advantage of low commissions, deep liquidity, and spreads from 0.0 pips (additional fees may apply). Open your FXOpen account now or learn more about trading forex with FXOpen.
This article represents the opinion of the Companies operating under the FXOpen brand only. It is not to be construed as an offer, solicitation, or recommendation with respect to products and services provided by the Companies operating under the FXOpen brand, nor is it to be considered financial advice.
Stay ahead of the market!
Subscribe now to our mailing list and receive the latest market news and insights delivered directly to your inbox.


Latest articles

EUR/USD Eyes Gains As USD/CHF Weakness Deepens Again
EUR/USD started a fresh increase above 1.1700 and 1.1720. USD/CHF declined further and is now struggling below 0.7835.
Important Takeaways for EUR/USD and USD/CHF Analysis Today
· The Euro started a decent increase from

Apple: Earnings Day Above the Activity Zone
On 30 April, after the market close, Apple Inc. will release its financial results for the second quarter of fiscal 2026. The consensus forecast, based on estimates from 31 analysts, points to revenue of around $109.7 billion, with expected

USD/JPY and USD/CHF Near Key Levels: The Dollar Supported by the Fed
The US dollar continues to trend upwards following the Federal Reserve meeting, drawing support from the regulator’s moderately hawkish stance and comments by Jerome Powell. Markets interpret the Fed’s rhetoric as a signal that restrictive policy is likely