


GBP/USD and USD/CAD: Dollar Gains Traction
FXOpen
GBP/USD started a major decline below the 1.3500 support. USD/CAD gained bullish momentum for a move above the 1.2700 level.
Important Takeaways for GBP/USD and USD/CAD
· The British Pound started a fresh decline from the 1.3650 resistance zone.
· There is a key bearish trend line forming with resistance near 1.3430 on the hourly chart of GBP/USD.
· USD/CAD started a fresh increase from well below the 1.2500 zone.
· There is a major bullish trend line forming with support near 1.2660 on the hourly chart.
GBP/USD Technical Analysis
After struggling to clear the 1.3660 resistance zone, the British Pound found started a fresh decline against the US Dollar. GBP/USD traded below the 1.3550 support level to move into a bearish zone.
The bears gained strength for a move below the 1.3500 level and the 50 hourly simple moving average. The pair even spiked below the 1.3400 level and traded as low as 1.3357 on FXOpen. It is now consolidating above the 1.3380 level.
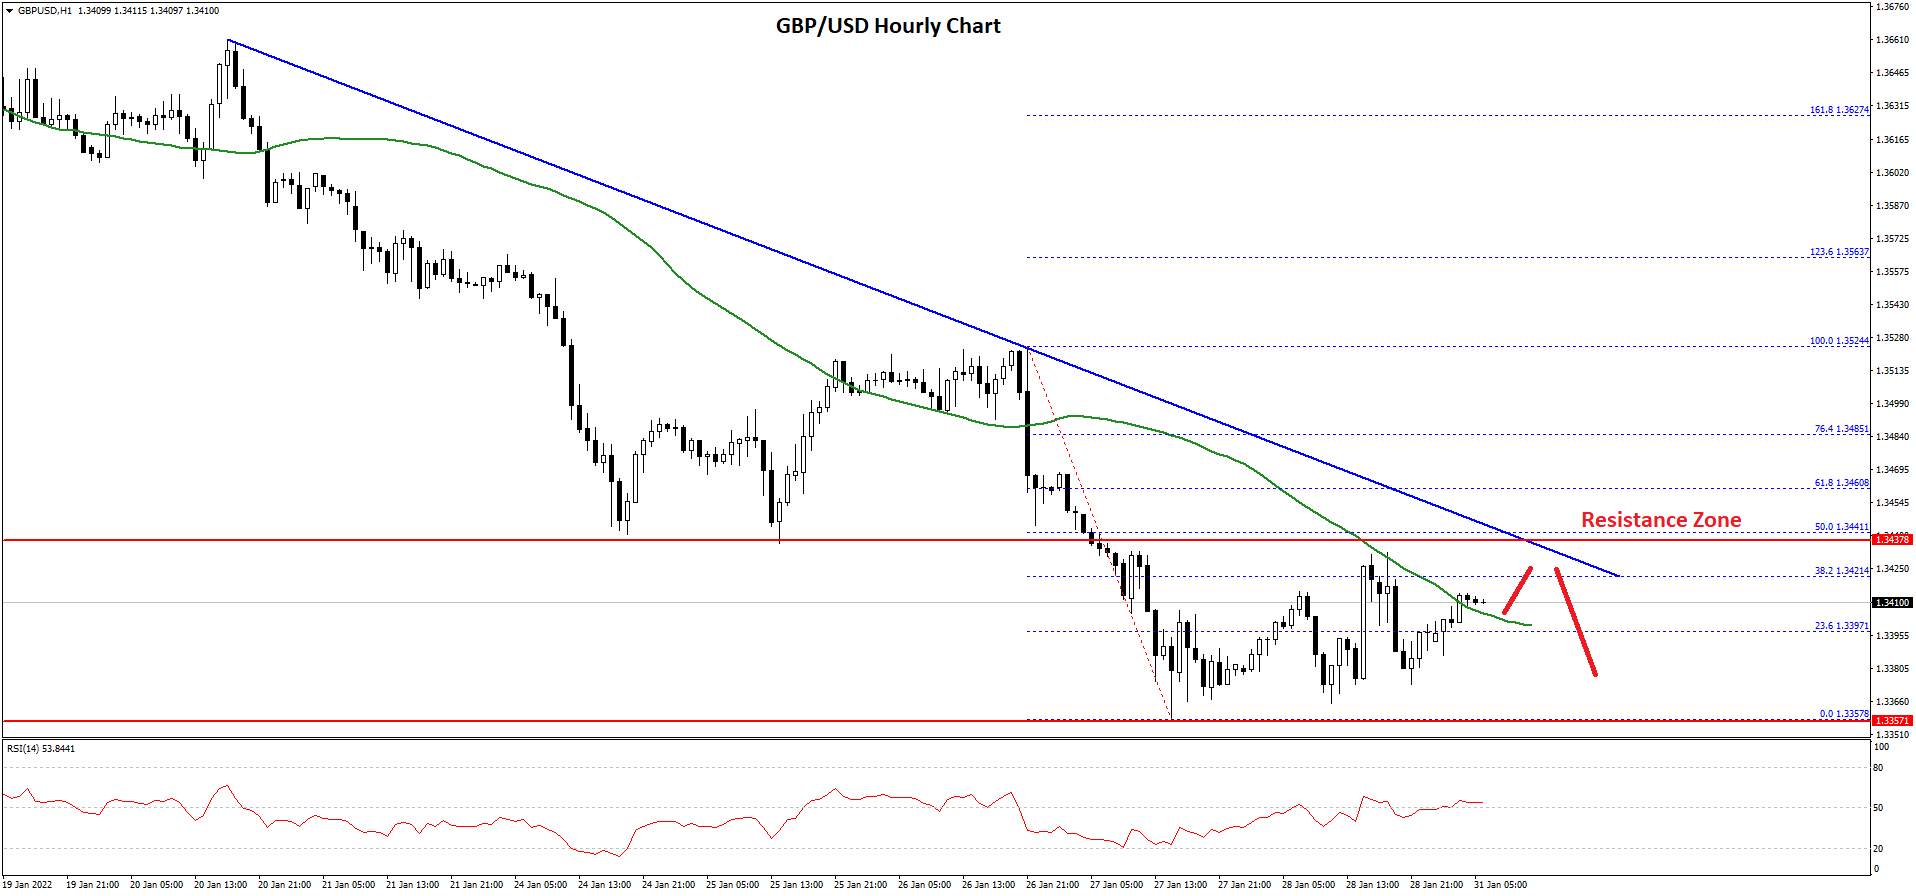
An immediate resistance is near the 1.3420 level. It is near the 38.2% Fib retracement level of the downward move from the 1.3524 swing high to 1.3357 low.
The first major resistance is near the 1.3440 level. There is also a key bearish trend line forming with resistance near 1.3430 on the hourly chart of GBP/USD. The trend line is near the 50% Fib retracement level of the downward move from the 1.3524 swing high to 1.3357 low.
If there is an upside break above the 1.3440 zone, the pair could rise towards 1.3500. The next key resistance could be 1.3550, above which the pair could gain strength.
On the downside, the first support is near the 1.3380 area. The first major support is near the 1.3350 level. If there is a break below 1.3350, the pair could extend its decline. The next key support is near the 1.3250 level. Any more losses might call for a test of the 1.3200 support.
USD/CAD Technical Analysis
The US Dollar started a fresh increase from the 1.2450 zone against the Canadian Dollar. USD/CAD gained pace for a move above the 1.2500 resistance zone.
The pair settled above the 1.2550 level and the 50 hourly simple moving average. The pair even climbed above the 1.2650 level. It traded as high as 1.2796 and is currently correcting lower. There was a move below the 1.2750 support level.
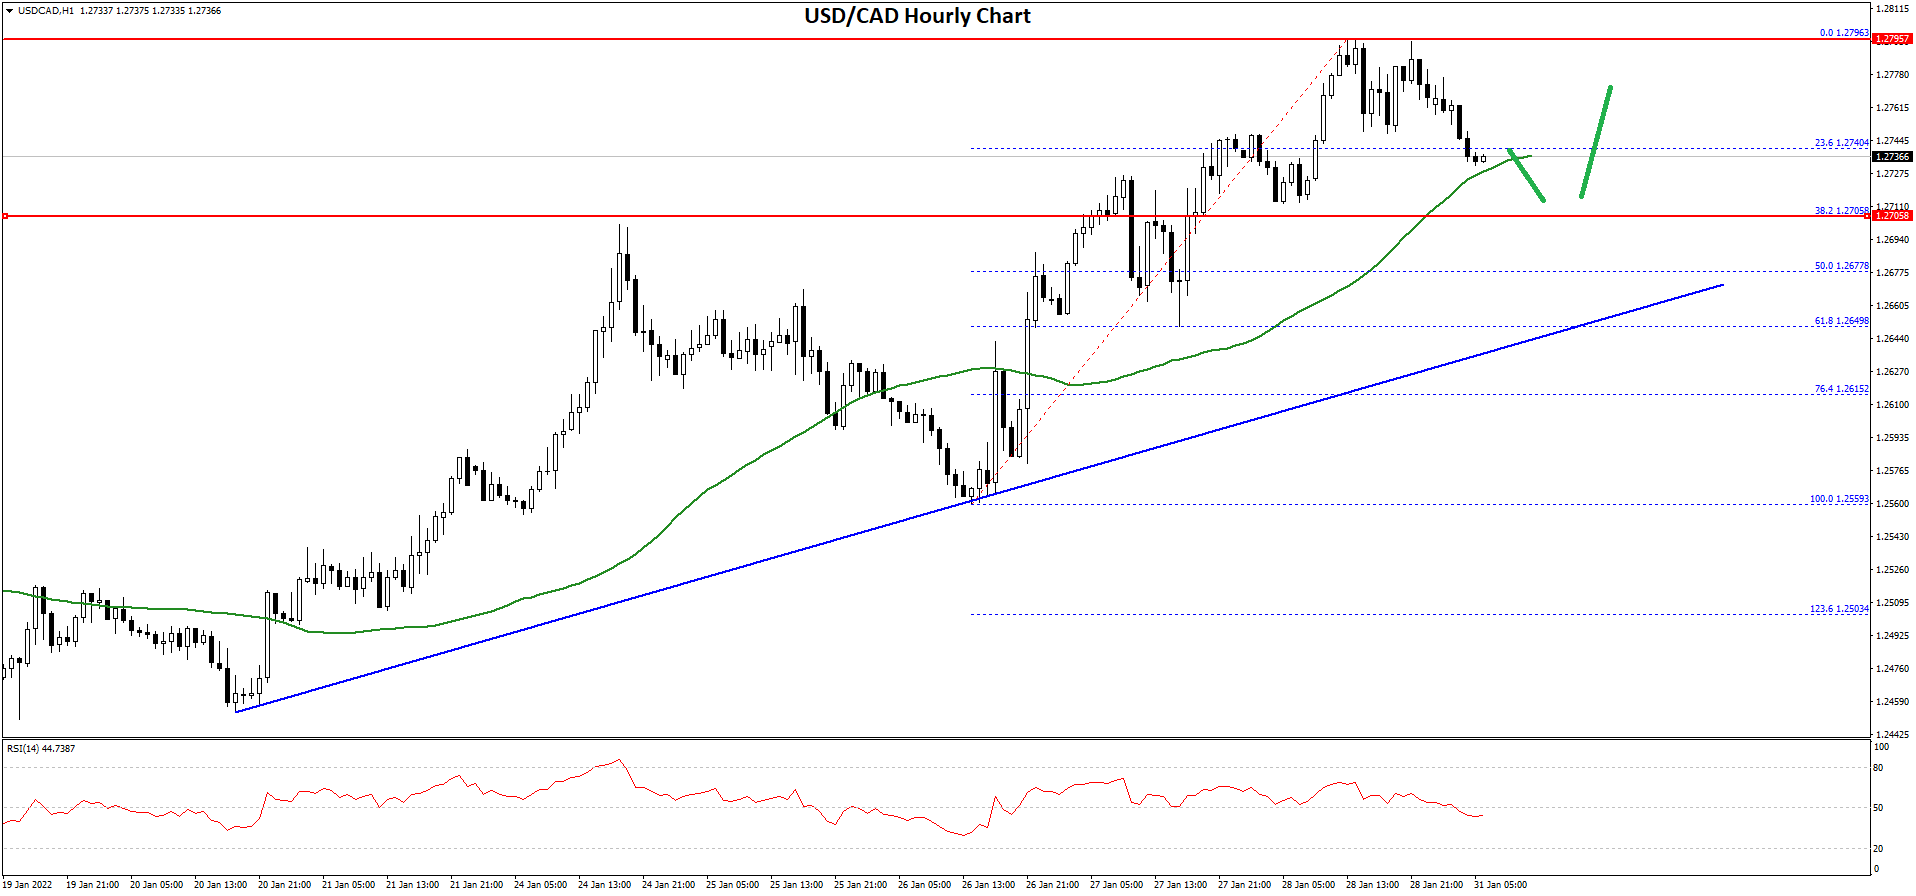
The pair is now trading near the 23.6% Fib retracement level of the upward move from the 1.2559 swing low to 1.2796 high.
An immediate support is near the 1.2735 level and the 50 hourly simple moving average. The first major support is near the 1.2675 level. There is also a major bullish trend line forming with support near 1.2660 on the hourly chart.
The trend line is near the 50% Fib retracement level of the upward move from the 1.2559 swing low to 1.2796 high. Any more losses may possibly open the doors for a drop towards the 1.2550 support. The next major support is near the 1.2500 level.
An immediate hurdle on the upside is near the 1.2750 level. The next major resistance is near the 1.2800 level. A clear break above the 1.2800 level could open the doors for more gains. The next major resistance is near the 1.2880 level.
This forecast represents FXOpen Markets Limited opinion only, it should not be construed as an offer, invitation or recommendation in respect to FXOpen Markets Limited products and services or as financial advice.
Trade over 50 forex markets 24 hours a day with FXOpen. Take advantage of low commissions, deep liquidity, and spreads from 0.0 pips (additional fees may apply). Open your FXOpen account now or learn more about trading forex with FXOpen.
This article represents the opinion of the Companies operating under the FXOpen brand only. It is not to be construed as an offer, solicitation, or recommendation with respect to products and services provided by the Companies operating under the FXOpen brand, nor is it to be considered financial advice.
Stay ahead of the market!
Subscribe now to our mailing list and receive the latest market news and insights delivered directly to your inbox.


Latest articles

US Dollar Strengthens Amid Equity Market Weakness and Hawkish Fed Rhetoric
The US dollar continues to hold firm near multi-year highs as sentiment across equity markets deteriorates and investors increasingly expect the Federal Reserve to maintain a restrictive monetary policy stance for longer. The US economy remains resilient, while inflation risks

Bitcoin: Corrective Channel Broken as Traders Turn More Active
Bitcoin has come under the influence of several factors simultaneously. The wave of selling at the beginning of June was linked to Strategy's first disclosed Bitcoin sale in several years, a prolonged series of outflows from spot ETFs, and a

DAX 40: consolidation amid technology sell-off
A wave of selling in the technology sector that emerged earlier this week has weighed on European equities. The trigger was investor concern over the profitability of large-scale debt-funded investments by major US tech companies in AI infrastructure. The Nasdaq