


GBP/USD and USD/CAD Eyeing Upside Break
FXOpen
GBP/USD struggled to settle above 1.2880 and declined recently. USD/CAD is currently basing near the 1.3200 for the next upward move in the short term.
Important Takeaways for GBP/USD and USD/CAD
- The British Pound is placed nicely above the 1.2770 and 1.2780 support levels.
- There is a short term breakout pattern forming with resistance near the 1.2825 level on the hourly chart of GBP/USD.
- USD/CAD is holding the 1.3180 and 1.3200 support levels, with positive signs.
- The pair is approaching the next break either above 1.3240 or below 1.3180.
GBP/USD Technical Analysis
After forming a support base near 1.2770, the British Pound found started a nice upward move against the US Dollar. The GBP/USD pair traded above the 1.2850 and 1.2870 resistance levels.
However, the pair failed to surpass the 1.2930 resistance level and topped near the 1.2927 level on FXOpen. The pair dropped below 1.2900 and it seems like buyers failed to hold gains above the 1.2880 level.
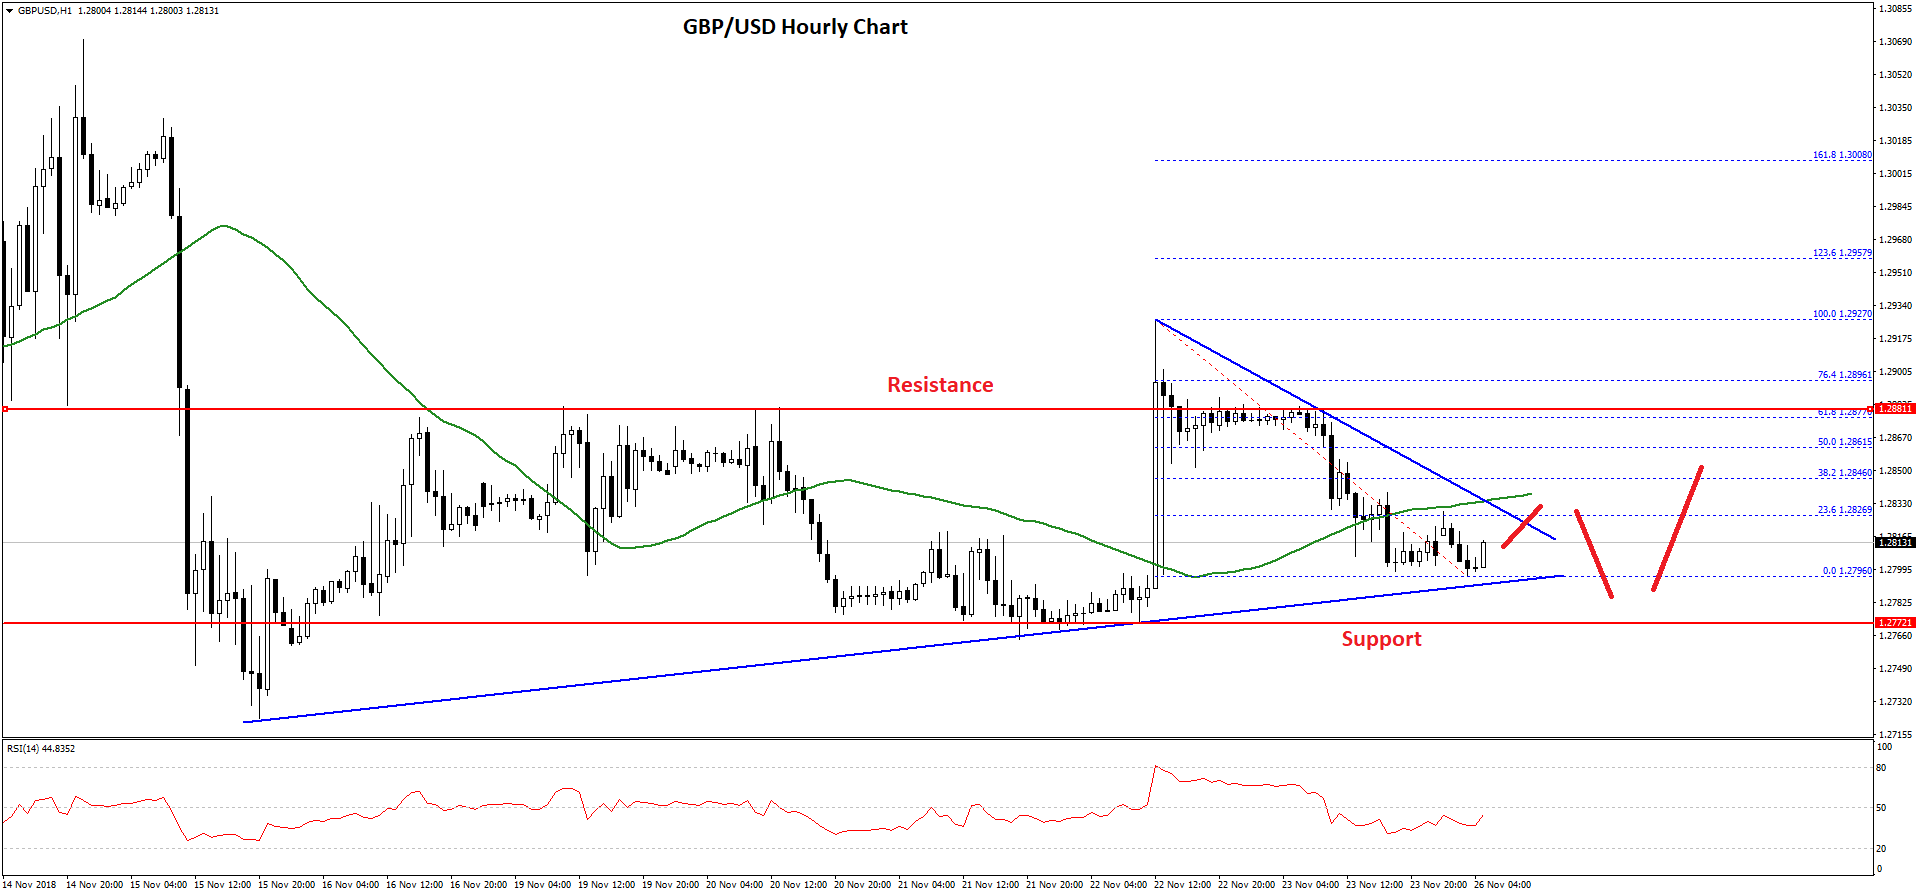
There was a sharp downside move and the pair retested the 1.2800 support area. A new intraday low was formed at 1.2790 and the pair is currently consolidating losses. An initial resistance is near the 23.6% Fib retracement level of the recent decline from the 1.2927 high to 1.2796 low.
More importantly, there is a short term breakout pattern forming with resistance near the 1.2825 level on the hourly chart. The trend line resistance is near the 50 hourly simple moving average at 1.2840.
Therefore, a break above the 1.2825 and 1.2840 levels could open the doors for a decent upward move. The next resistance is near 1.2865 and the 50% Fib retracement level of the recent decline from the 1.2927 high to 1.2796 low.
On the flip side, if there is a downside break below 1.2800, the pair could retest the key 1.2770 support area. Below 1.2770, the pair may decline sharply towards the 1.2720 support area in the near term.
USD/CAD Technical Analysis
The US Dollar followed a solid bullish path this past week and traded above the 1.3200 and 1.3250 resistance levels against the Canadian Dollar. The USD/CAD pair even gained pace above the 1.3300 level and formed a high near 1.3318.
Later, there was a sharp downside reaction and the pair declined below 1.3300 and 1.3250. There was even a close below the 1.3250 level and the 50 hourly simple moving average. The pair traded as low as 1.3182 and later started an upside correction.
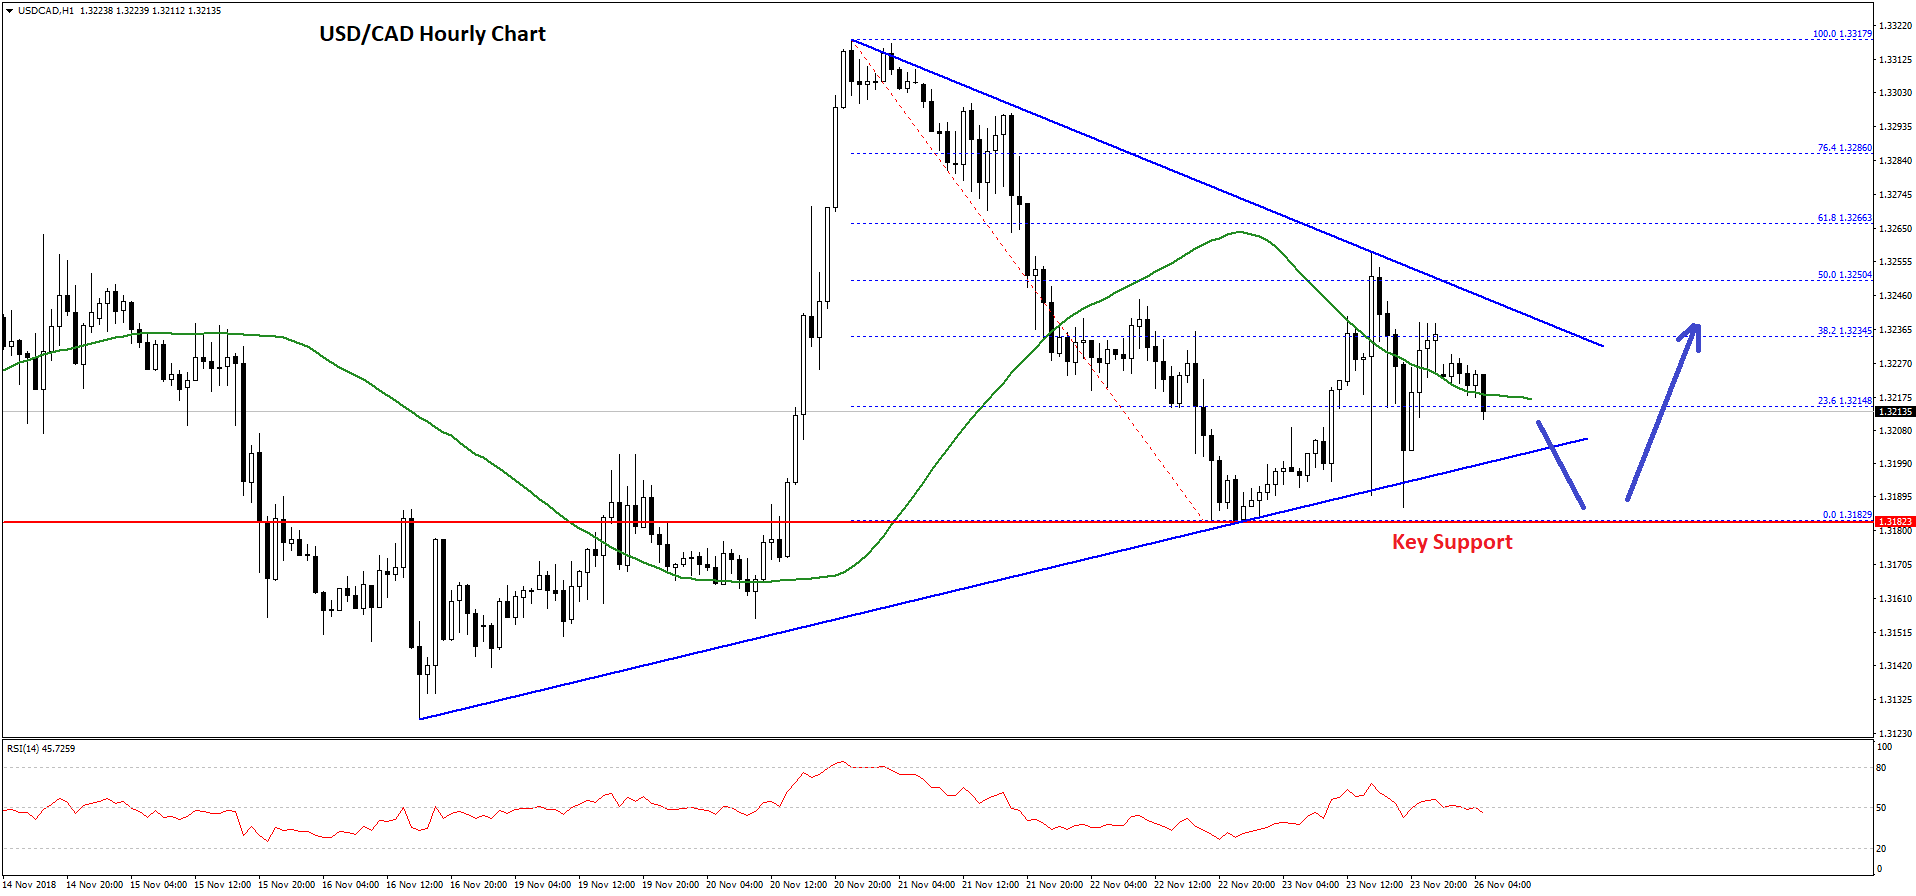
It moved above the 1.3220 level and the 23.6% Fib retracement level of the recent decline from the 1.3317 high to 1.3182 low. However, the upward move was capped by the 1.3250 resistance and a connecting major bearish trend line with current resistance at 1.3240 on the hourly chart.
Moreover, there was no break above the 50% Fib retracement level of the recent decline from the 1.3317 high to 1.3182 low. At the moment, the pair is trading near the 1.3200 level and it is likely approaching the next break either above 1.3240 or below 1.3180.
A break above 1.3240 could open the doors for more gains in USD/CAD above the 1.3250 and 1.3280 levels. On the downside, the 1.3180 support is very important, below which the pair may perhaps decline towards the 1.3120 support area.
Trade over 50 forex markets 24 hours a day with FXOpen. Take advantage of low commissions, deep liquidity, and spreads from 0.0 pips (additional fees may apply). Open your FXOpen account now or learn more about trading forex with FXOpen.
This article represents the opinion of the Companies operating under the FXOpen brand only. It is not to be construed as an offer, solicitation, or recommendation with respect to products and services provided by the Companies operating under the FXOpen brand, nor is it to be considered financial advice.
Stay ahead of the market!
Subscribe now to our mailing list and receive the latest market news and insights delivered directly to your inbox.


Latest articles

US Dollar Strengthens Amid Equity Market Weakness and Hawkish Fed Rhetoric
The US dollar continues to hold firm near multi-year highs as sentiment across equity markets deteriorates and investors increasingly expect the Federal Reserve to maintain a restrictive monetary policy stance for longer. The US economy remains resilient, while inflation risks

Bitcoin: Corrective Channel Broken as Traders Turn More Active
Bitcoin has come under the influence of several factors simultaneously. The wave of selling at the beginning of June was linked to Strategy's first disclosed Bitcoin sale in several years, a prolonged series of outflows from spot ETFs, and a

DAX 40: consolidation amid technology sell-off
A wave of selling in the technology sector that emerged earlier this week has weighed on European equities. The trigger was investor concern over the profitability of large-scale debt-funded investments by major US tech companies in AI infrastructure. The Nasdaq