


GBP/USD and USD/CAD Facing Significant Resistance
FXOpen
GBP/USD recently recovered, but struggled to clear the 1.3125-1.3130 resistance area. USD/CAD declined recently and it may continue to move down towards the 1.3285 support.
Important Takeaways for GBP/USD and USD/CAD
- The British Pound faced a strong resistance on a few occasions near the 1.3130 level.
- There is a major bullish trend line formed with support at 1.3080 on the hourly chart of GBP/USD.
- USD/CAD declined recently and broke the key support near the 1.3350 level.
- The pair broke a key bullish trend line with support at 1.3355 on the hourly chart.
GBP/USD Technical Analysis
The British Pound declined heavily this past week and traded below the 1.3100 support area against the US Dollar. The GBP/USD pair even broke the 1.3050 support and traded towards the 1.3000 support area.
A swing low was formed near 1.3000 on FXOpen and later the pair started a decent recovery. There was a break above the 1.3080 resistance and the 50 hourly simple moving average. The pair even moved above the 1.3100 level, but it faced a strong resistance near the 1.3130 level.
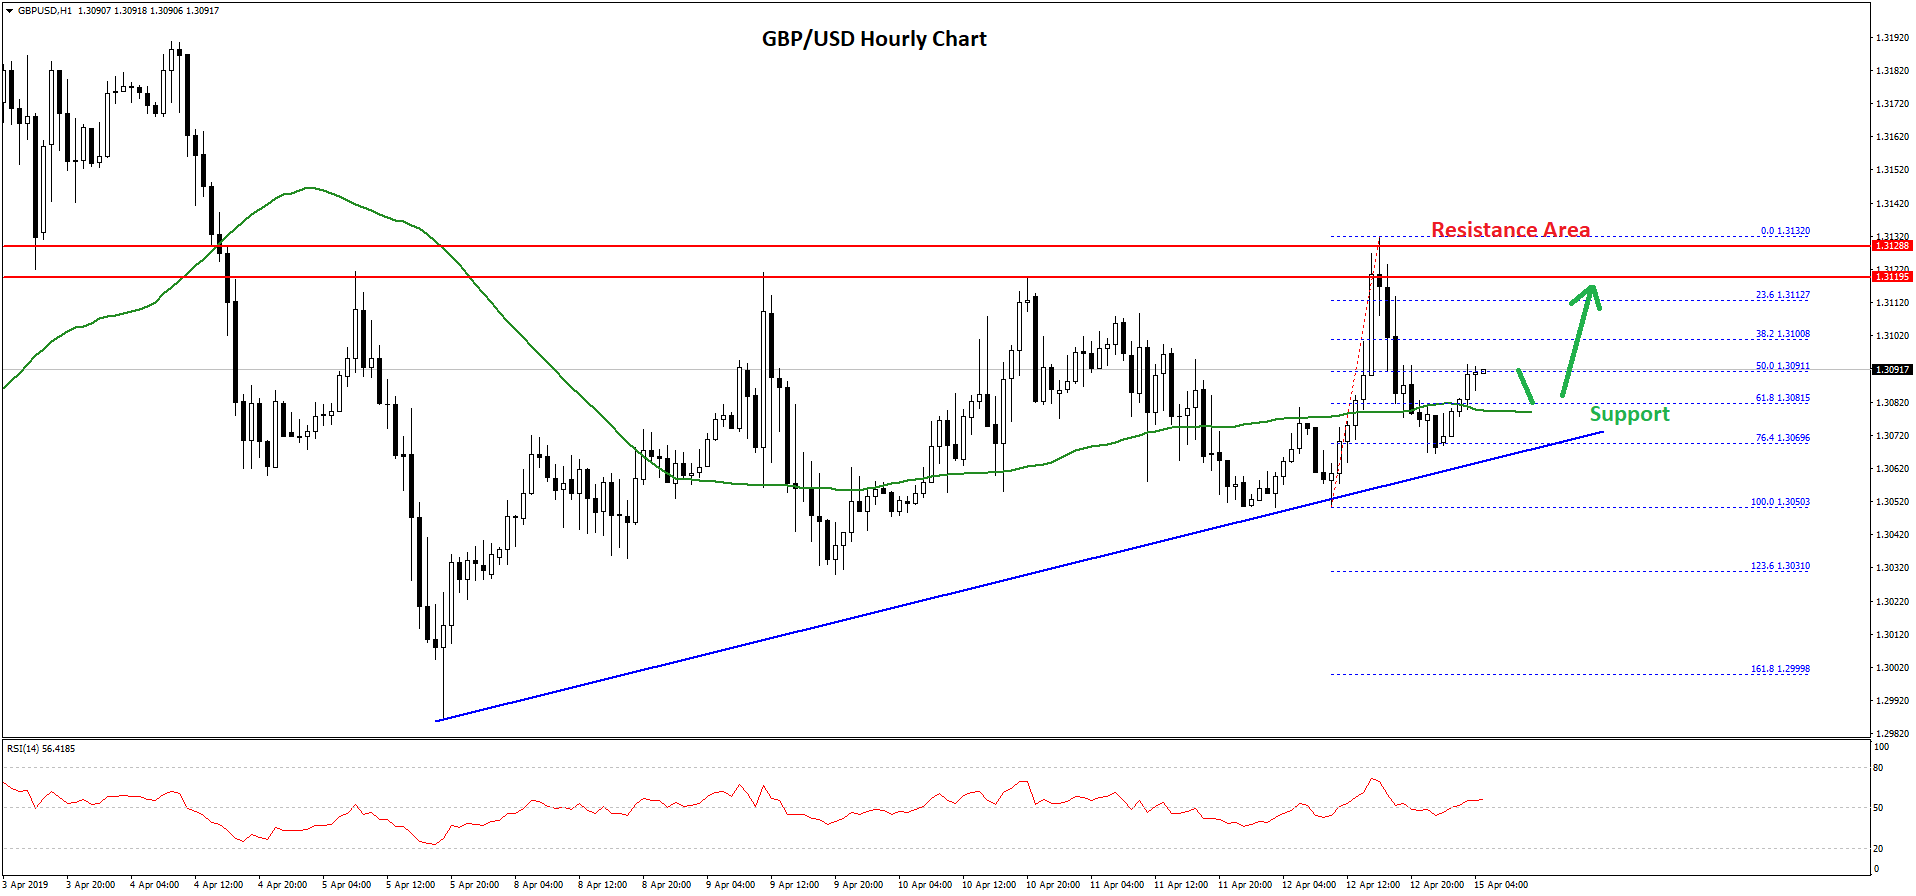
There were a couple of attempts to clear the 1.3130 resistance area, but buyers failed to gain traction. The last swing high was formed at 1.3132 before the pair started a fresh decline. It broke the 50% Fib retracement level of the last wave from the 1.3050 low to 1.3132 high.
The pair even broke the 1.3080 level before buyers appeared near 1.3068 and the 76.4% Fib retracement level of the last wave from the 1.3050 low to 1.3132 high.
There is also a major bullish trend line formed with support at 1.3080 on the hourly chart of GBP/USD. The pair is slowly moving higher and it is currently trading above 1.3080 and the 50 hourly simple moving average.
It seems like the pair might continue to rise towards the 1.3130 resistance area. If this time bulls gain pace above 1.3130, GBP/USD might climb further higher towards 1.3150 or 1.3180.
On the downside, an immediate support is at 1.3080, followed by the 1.3070 support. Any further losses may push the pair below the 1.3050 support level in the near term.
USD/CAD Technical Analysis
The US Dollar remained in a positive zone until it struggled to clear the 1.3395-1.3400 resistance area against the Canadian Dollar. The USD/CAD pair likely formed a double top pattern near the 1.3395-1.3400 resistance area and recently declined lower.
There was a sharp decline below the 1.3360 support and the 50 hourly simple moving average. Besides, the pair broke a key bullish trend line with support at 1.3355 on the hourly chart.
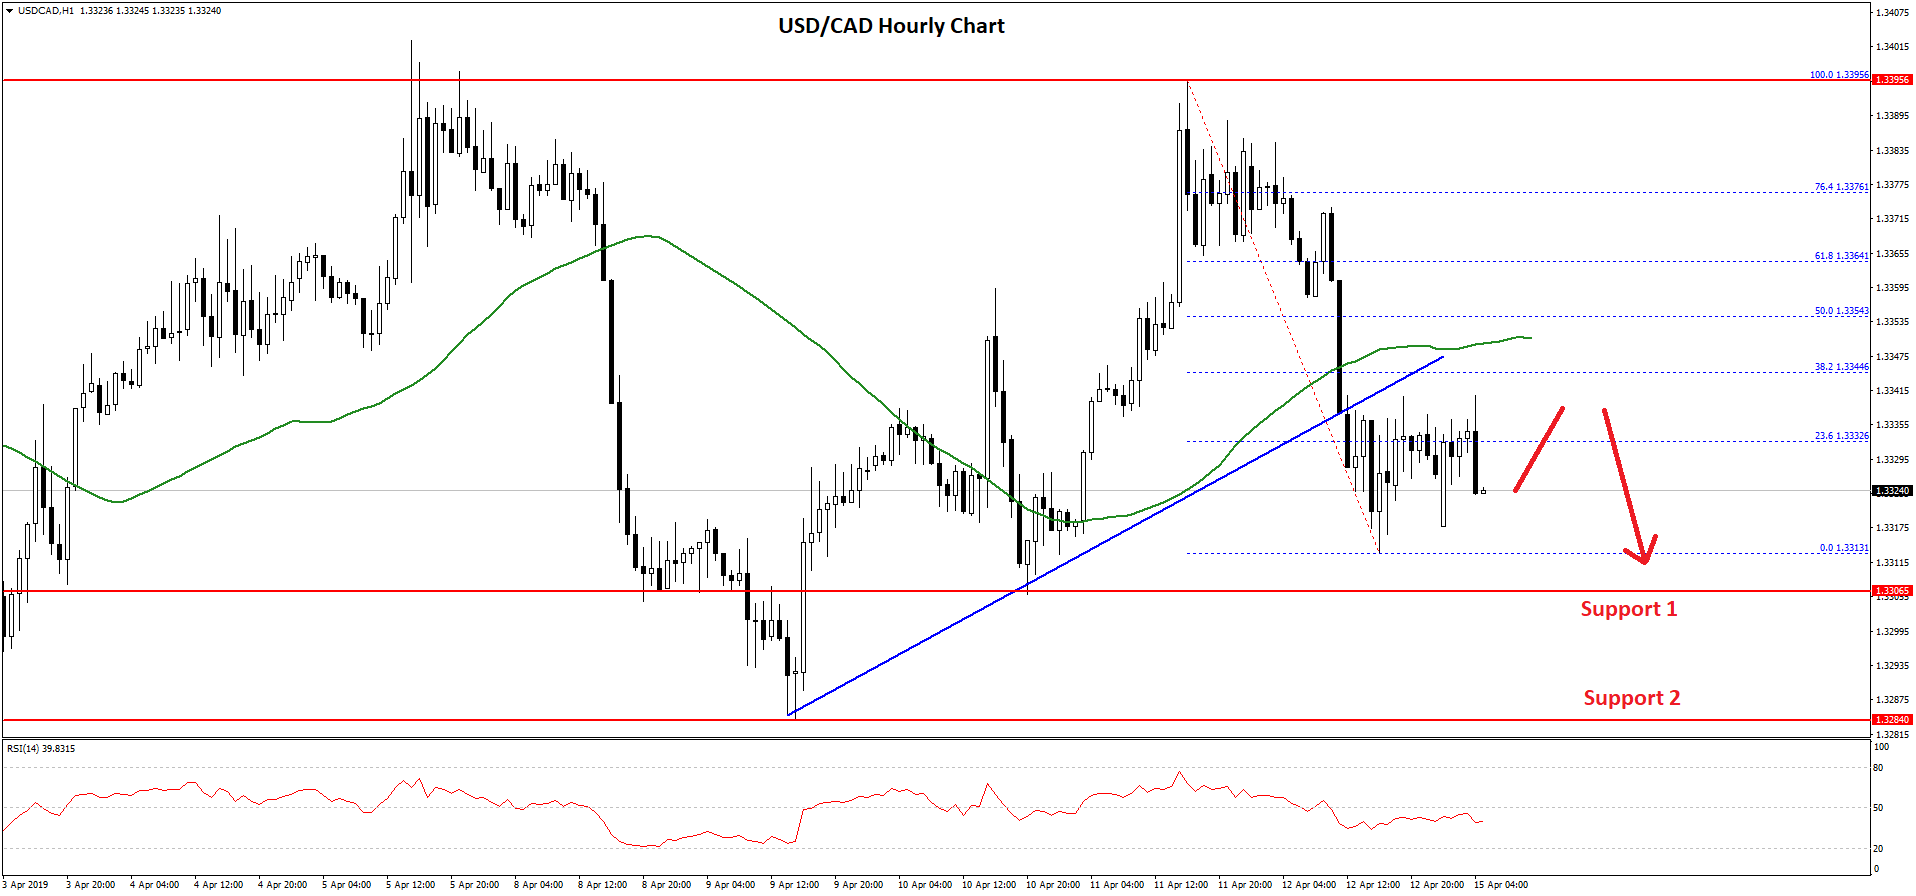
It opened the doors for more losses and the pair broke the 1.3320 support. A swing low was formed at 1.3313 and later the pair started a decent rebound. It recovered above the 23.6% Fib retracement level of the last decline from the 1.3395 high to 1.3313 low.
However, there is a strong resistance formed near the 1.3340 level. Moreover, the previous support at 1.3350 and the 50 hourly simple moving average are likely to act as solid hurdles for buyers.
The main resistance is at 1.3355 and the 50% Fib retracement level of the last decline from the 1.3395 high to 1.3313 low. If the pair fails to move above the 1.3350 resistance zone, it is likely to extend losses below the 1.3310 and 1.3300 support levels.
Trade over 50 forex markets 24 hours a day with FXOpen. Take advantage of low commissions, deep liquidity, and spreads from 0.0 pips (additional fees may apply). Open your FXOpen account now or learn more about trading forex with FXOpen.
This article represents the opinion of the Companies operating under the FXOpen brand only. It is not to be construed as an offer, solicitation, or recommendation with respect to products and services provided by the Companies operating under the FXOpen brand, nor is it to be considered financial advice.
Stay ahead of the market!
Subscribe now to our mailing list and receive the latest market news and insights delivered directly to your inbox.


Latest articles

DAX 40: consolidation amid technology sell-off
A wave of selling in the technology sector that emerged earlier this week has weighed on European equities. The trigger was investor concern over the profitability of large-scale debt-funded investments by major US tech companies in AI infrastructure. The Nasdaq

Euro Hits Fresh Yearly Lows Amid Dovish ECB Signals
The euro remains under pressure following weak macroeconomic data from the euro area and fresh signals that the European Central Bank is prepared to maintain a more accommodative monetary policy stance. Data released yesterday pointed to a deterioration in business

Pound at Key Levels: Markets Assess Impact of Political Uncertainty in the UK
The British pound remains under pressure following increased political uncertainty in the United Kingdom triggered by the Prime Minister’s resignation. Investors are assessing potential shifts in the political and economic policy outlook after the head of government stepped down,