


GBP/USD and USD/CAD Facing Significant Resistances
FXOpen
GBP/USD is facing major resistances near 1.3160 and 1.3200. Similarly, USD/CAD is approaching significant hurdles near 1.3080 and 1.3100.
Important Takeaways for GBP/USD and USD/CAD
- The British Pound recovered after trading as low as 1.2957 versus the US Dollar.
- The GBP/USD pair is facing a major bearish trend line with resistance near 1.3160 on the 4-hours chart.
- USD/CAD is attempting a break above a key bearish trend line with resistance at 1.3075.
- On the upside, there are significant barriers near the 1.3080 and 1.3105 levels.
GBP/USD Technical Analysis
The British Pound started a nice upside move after trading as low as 1.2957 against the US Dollar. The GBP/USD pair traded above the 1.3000 and 1.3120 resistance levels to move into a bullish zone.
The pair even traded above the 1.3200 resistance and the 50 simple moving average (4-hour). However, buyers failed to hold gains above the 1.3200 level and the pair dipped towards 1.3100. During the decline, there was a break below a bullish trend line with support at 1.3180 on the 4-hours chart.
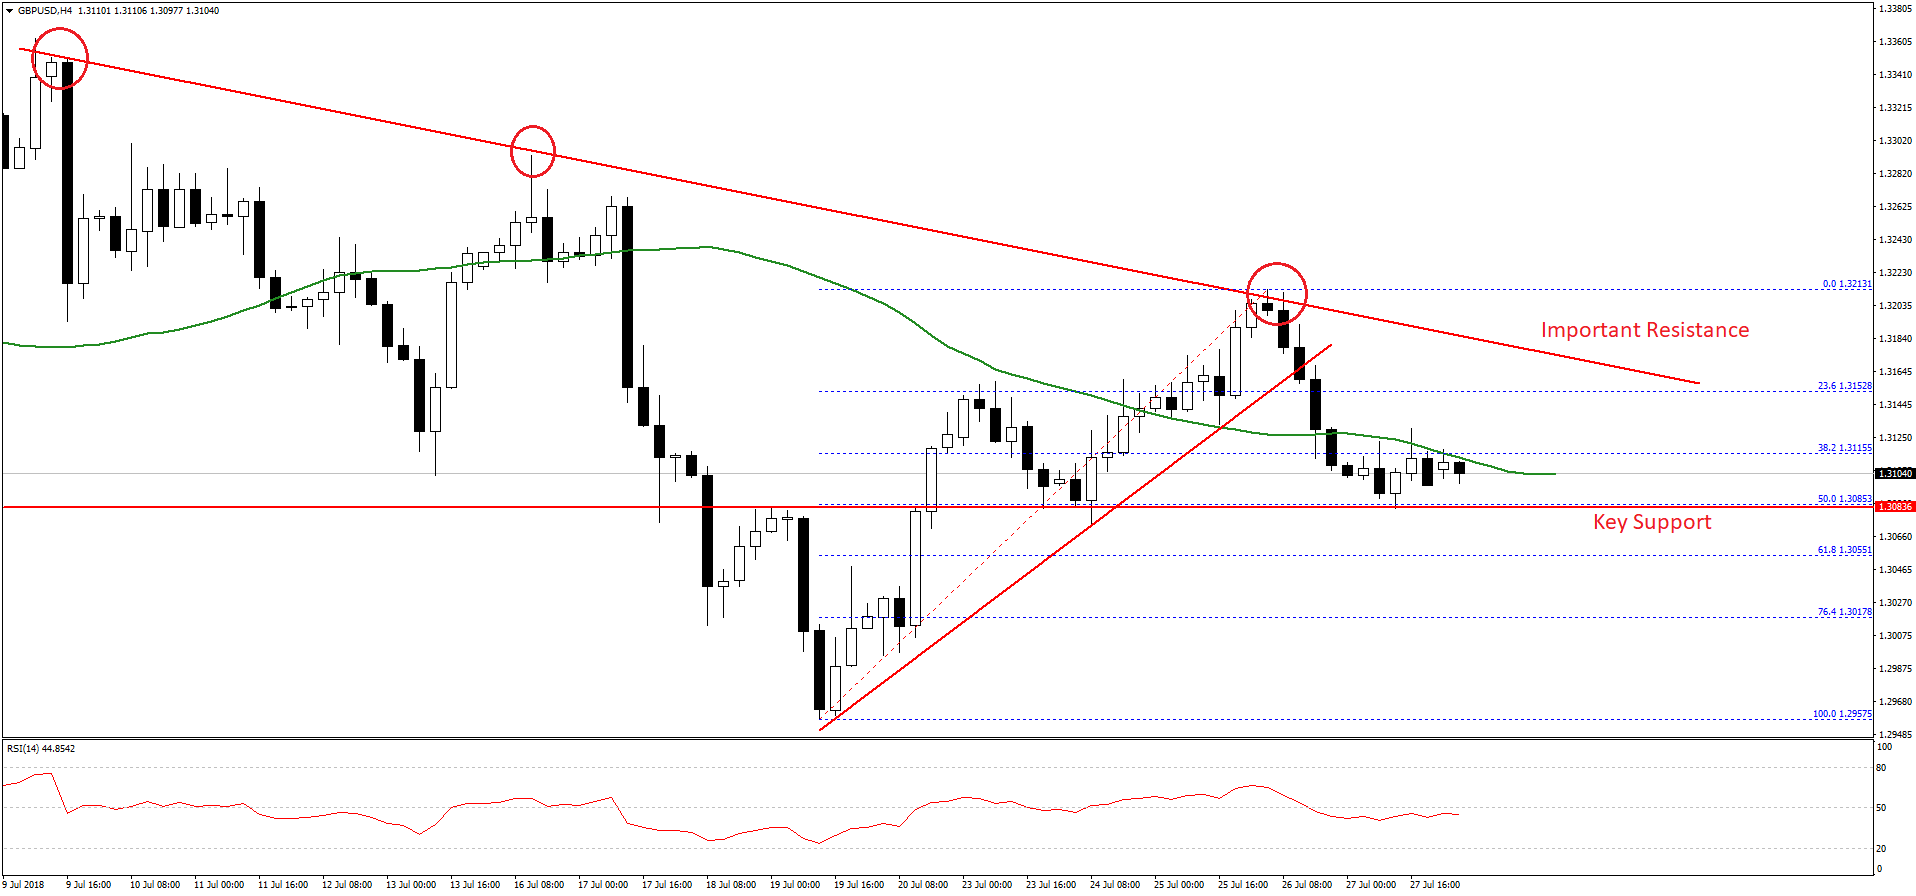
Moreover, the pair broke the 23.6% Fib retracement level of the last wave from the 1.2957 low to 1.3213 high. It opened the doors for more losses and the pair traded below 1.3100 and the 50 SMA.
The 50% Fib retracement level of the last wave from the 1.2957 low to 1.3213 high was tested, which acted as a support. At the moment, the pair is consolidating below the 1.3120 level and the 50 SMA. A break and close below the 1.3080 level could clear the path for more declines.
The next support on the downside is at 1.3015 followed by 1.3000. On the upside, the pair is facing a major bearish trend line with resistance near 1.3160 on the same chart. A break and close above the 1.3220 level is needed for buyers to gain control.
Overall, the GBP/USD pair is under pressure, and a break below 1.3080 may perhaps increase selling pressure in the near term.
USD/CAD Technical Analysis
The US Dollar remained under a lot of bearish pressure below 1.3100 against the Canadian Dollar. The USD/CAD pair traded below the 1.3100 support area and settled below the 50 simple moving average (4-hour).
The pair traded close to the 1.3000 level and formed a low at 1.3024. Later, an upward correction was initiated and the pair traded above the 1.3050 resistance. There was a break above the 23.6% Fib retracement level of the last decline from the 1.3191 high to 1.3024 low.
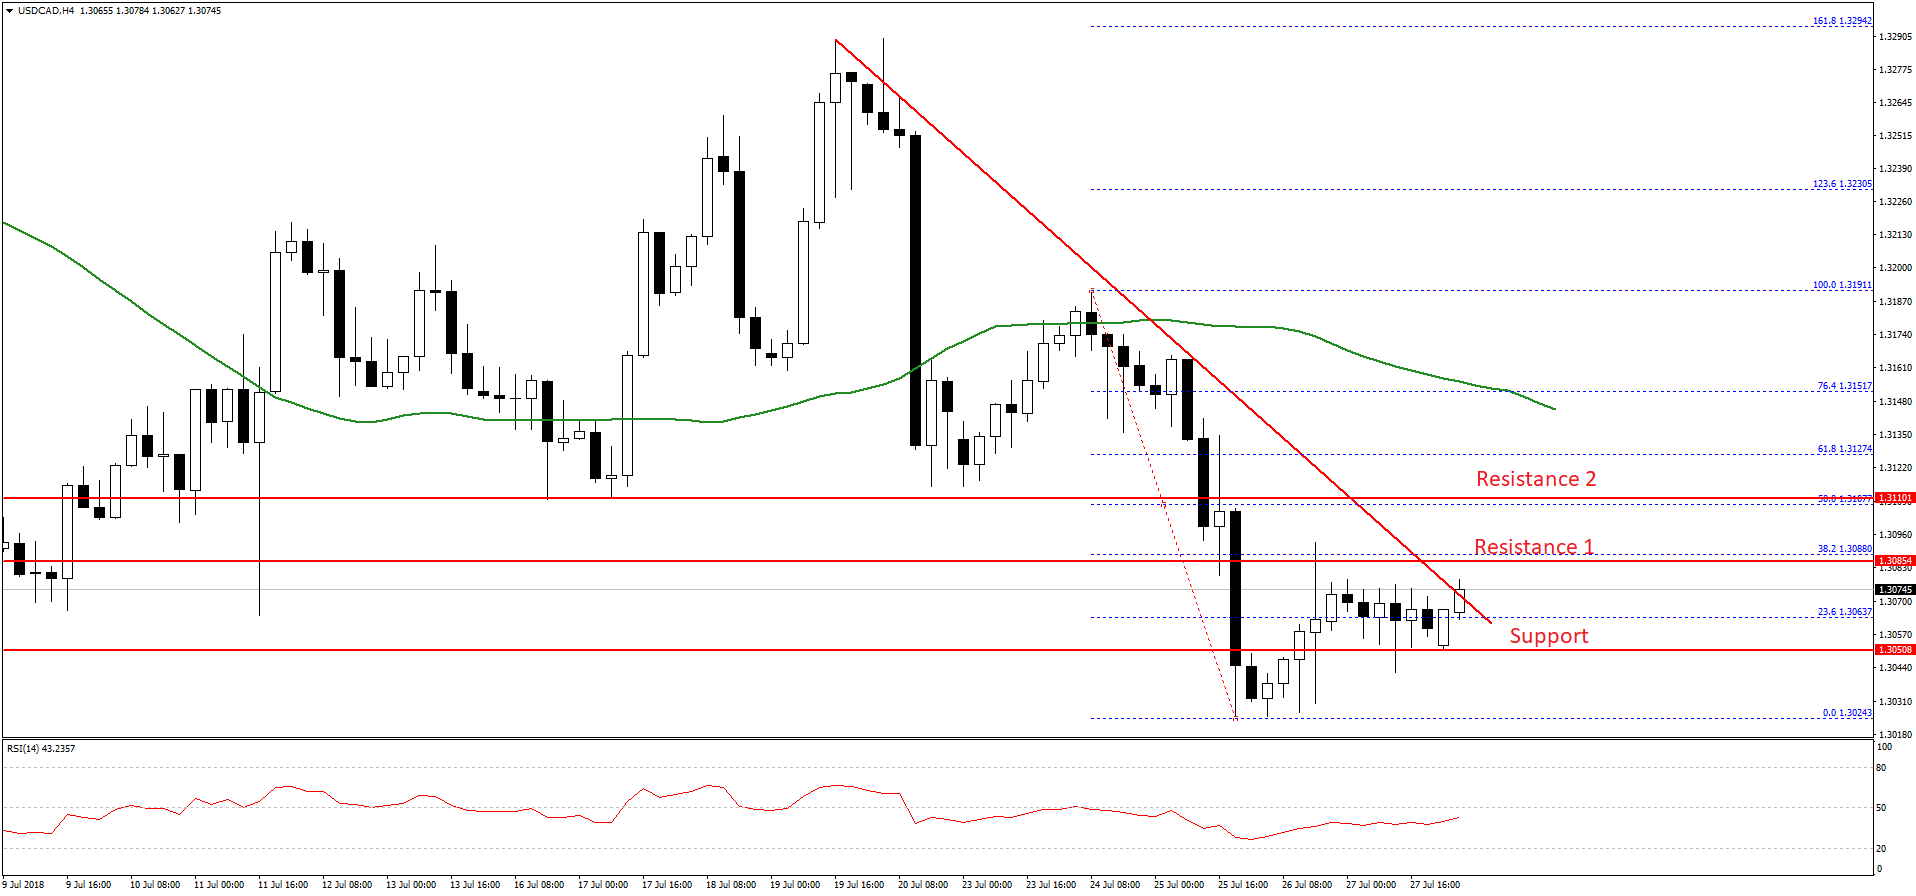
However, the upside move was capped by the 1.3080-90 resistance zone. At present, the pair is attempting a break above a key bearish trend line with resistance at 1.3075 on the 4-hours chart.
Should there be a break above the trend line, the pair may perhaps test the next resistance near 1.3088. Above this, the next major hurdle is near 1.3105, which coincides with the 50% Fib retracement level of the last decline from the 1.3191 high to 1.3024 low.
Only a successful close above the 1.3105-10 resistance zone could clear the path for more gains in USD/CAD. On the flip side, if the pair fails to settle above the 1.3080 and 1.3105 resistance levels, it could decline once again.
An immediate support is at 1.3050, below which, the pair is likely to move towards the 1.3000 handle in the near term.
Trade over 50 forex markets 24 hours a day with FXOpen. Take advantage of low commissions, deep liquidity, and spreads from 0.0 pips (additional fees may apply). Open your FXOpen account now or learn more about trading forex with FXOpen.
This article represents the opinion of the Companies operating under the FXOpen brand only. It is not to be construed as an offer, solicitation, or recommendation with respect to products and services provided by the Companies operating under the FXOpen brand, nor is it to be considered financial advice.
Stay ahead of the market!
Subscribe now to our mailing list and receive the latest market news and insights delivered directly to your inbox.


Latest articles

Apple: Earnings Day Above the Activity Zone
On 30 April, after the market close, Apple Inc. will release its financial results for the second quarter of fiscal 2026. The consensus forecast, based on estimates from 31 analysts, points to revenue of around $109.7 billion, with expected

USD/JPY and USD/CHF Near Key Levels: The Dollar Supported by the Fed
The US dollar continues to trend upwards following the Federal Reserve meeting, drawing support from the regulator’s moderately hawkish stance and comments by Jerome Powell. Markets interpret the Fed’s rhetoric as a signal that restrictive policy is likely

EUR/USD and GBP/USD consolidate ahead of the Fed decision
European currencies are showing subdued dynamics, entering a consolidation phase following their previous advance. Earlier, EUR/USD and GBP/USD broke out of their ranges and strengthened; however, the subsequent correction has led both pairs to retest the previously breached