


GBP/USD and USD/CAD Showing Positive Signs
FXOpen
GBP/USD traded higher and recently broke the 1.2500 resistance level. USD/CAD is consolidating in a broad range and it seems like it could rise in the coming sessions.
Important Takeaways for GBP/USD and USD/CAD
- The British Pound tested the 1.2385 level and later started a fresh upward move.
- There is a short term bearish trend line forming with resistance near 1.2518 on the hourly chart of GBP/USD.
- USD/CAD is facing a strong resistance near the 1.3090 and 1.3100 levels.
- There is a connecting bullish trend line forming with support near 1.3050 on the hourly chart.
GBP/USD Technical Analysis
The British Pound declined heavily this past week and even broke the 1.2450 support area against the US Dollar. The GBP/USD pair even broke the 1.2400 support level and traded as low as 1.2381 on FXOpen.
Later, the pair started a strong recovery above the 1.2400 and 1.2450 resistance levels. The bulls even pushed the pair above the 1.2500 resistance and 50 hourly simple moving average.
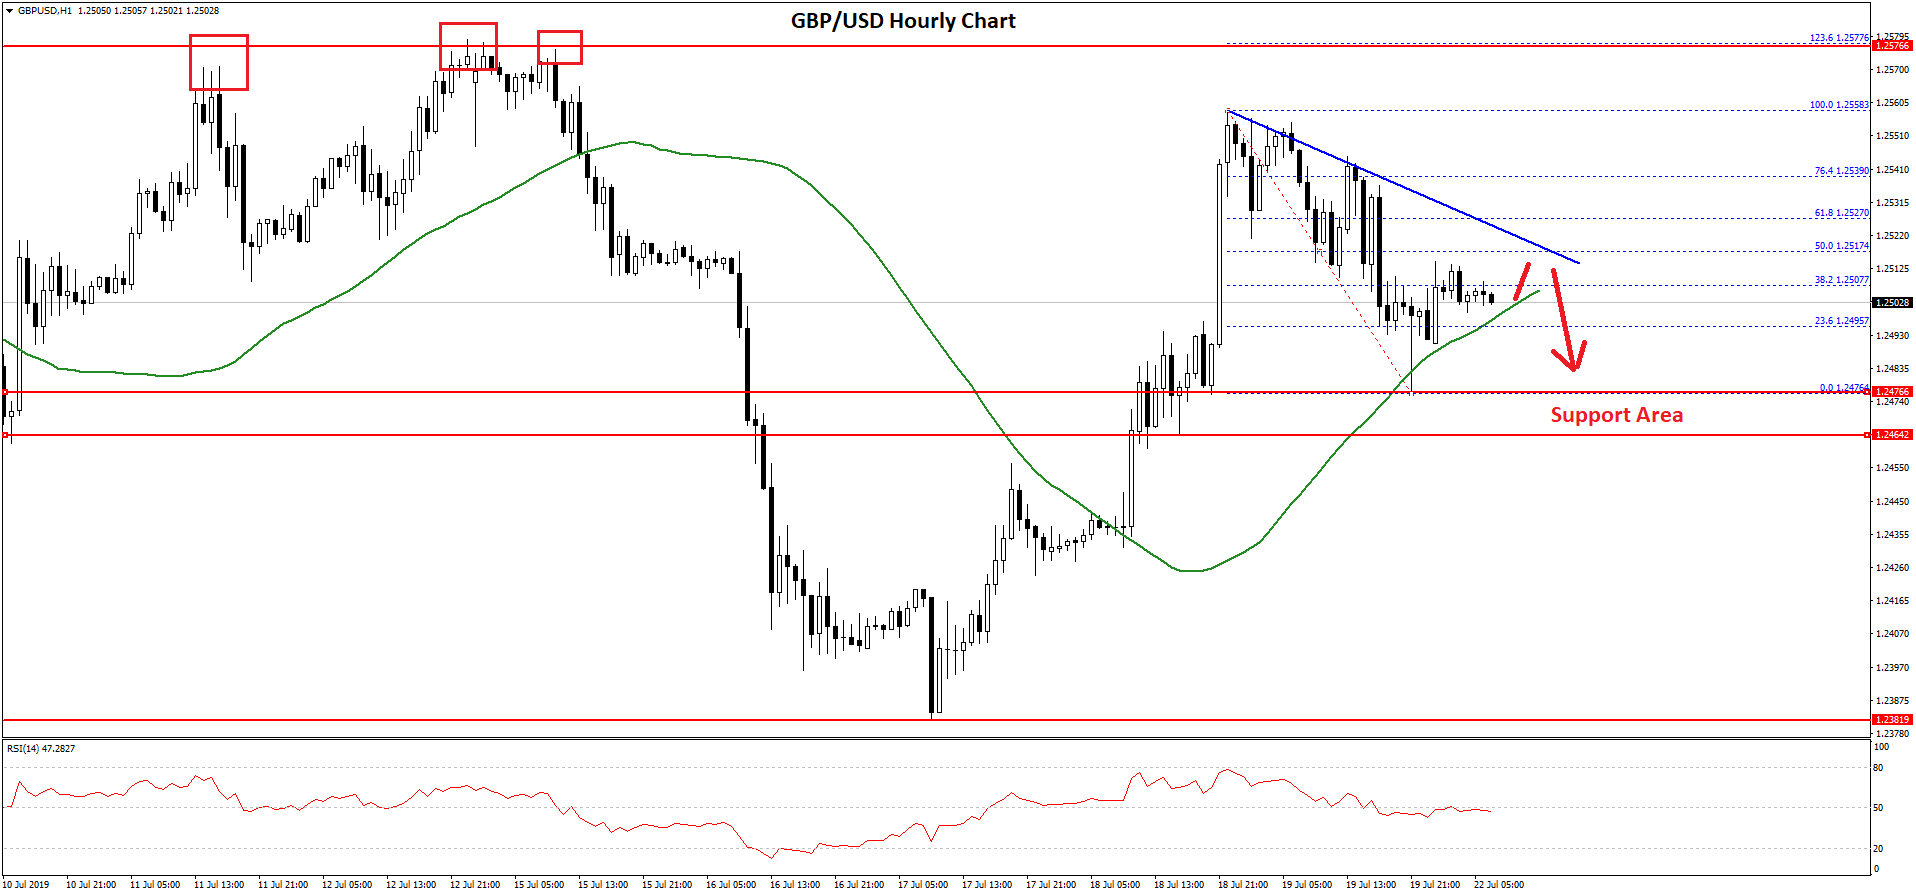
However, the upward move was capped just above 1.2550 and the pair declined back towards the 1.2475 level. It is currently correcting higher above the 1.2500 level plus the 23.6% Fib retracement level of the last decline from the 1.2558 high to 1.2474 low.
However, the pair is facing a lot of hurdles on the upside near the 1.2520 and 1.2540 levels. There is also a short term bearish trend line forming with resistance near 1.2518 on the hourly chart of GBP/USD.
The 50% Fib retracement level of the last decline from the 1.2558 high to 1.2474 low is also close to the trend line resistance. A close above the 1.2520 level is needed for a fresh wave towards the 1.2560 and 1.2580 resistance levels.
On the downside, an initial support is near the 1.2475 level, below which the pair extend the downside correction towards the 1.2440 level.
USD/CAD Technical Analysis
The US Dollar declined this past week and broke the 1.3100 and 1.3080 support levels against the Canadian Dollar. The USD/CAD pair even broke the 1.3050 level and tested the 1.3000 support area.
There were many attempts to trade below the 1.3000 support, but there was no downside break. The pair remained well supported and it recently corrected towards the 1.3070 level.
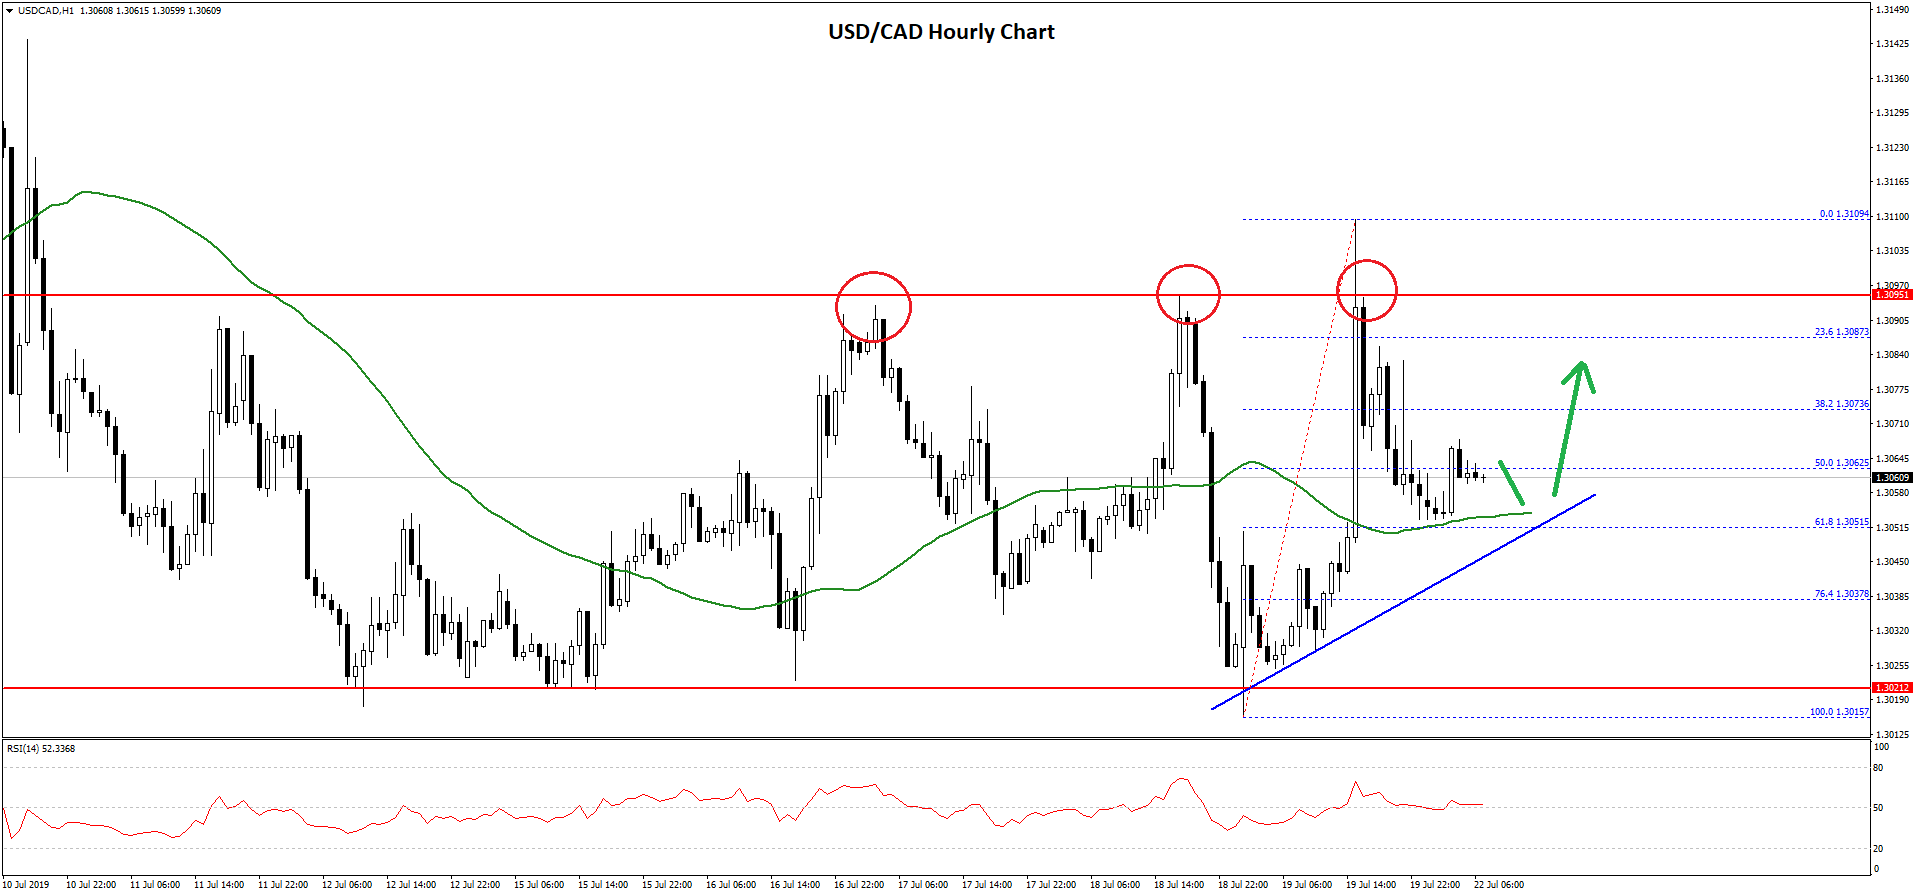
On the upside, there are many hurdles near the 1.3070, 1.3080 and 1.3100 levels. If there is a successful break above the 1.3100 resistance, the pair could rise towards the 1.3140 and 1.3165 levels.
At the moment, the pair is trading below the 1.3070 level and the 50% Fib retracement level of the last wave from the 1.3015 low to 1.3109 high. Moreover, there is a connecting bullish trend line forming with support near 1.3050 on the hourly chart.
The 61.8% Fib retracement level of the last wave from the 1.3015 low to 1.3109 high is also near the 1.3052 level along with the 50 hourly simple moving average.
Therefore, a successful close below the 1.3050 support level might increase bearish pressure in the near term. The main supports are near 1.3020 and 1.3000, below which there is a risk of more losses towards the 1.2950 level.
The overall price action is positive as long as USD/CAD is trading above the 1.3000 support area.
Trade over 50 forex markets 24 hours a day with FXOpen. Take advantage of low commissions, deep liquidity, and spreads from 0.0 pips (additional fees may apply). Open your FXOpen account now or learn more about trading forex with FXOpen.
This article represents the opinion of the Companies operating under the FXOpen brand only. It is not to be construed as an offer, solicitation, or recommendation with respect to products and services provided by the Companies operating under the FXOpen brand, nor is it to be considered financial advice.
Stay ahead of the market!
Subscribe now to our mailing list and receive the latest market news and insights delivered directly to your inbox.


Latest articles

Weekly Market Insights with Gary Thomson: The Week of Central Banks and Earnings
In this video, we’ll explore the key economic events and market trends, shaping the financial landscape. Get ready for insights into financial markets to help you navigate the week ahead. Let’s dive in!
In this episode of Market

Intel at a Crossroads: Earnings Beat Meets Technical Resistance
Intel has just delivered its strongest quarter in over fifteen years, and the market reaction says it all. Q2 2026 revenue surged 25% year-over-year to $16.1 billion, crushing the consensus estimate of $14.42 billion, while adjusted EPS of

Tesla: Complex Range Structure Breaks Down Following Quarterly Earnings
Tesla released its Q2 2026 results after the market closed on 22 July. Revenue increased 26% year-on-year to $28.24 billion, while vehicle deliveries reached a record 480,126 units. However, operating margin fell sharply to 1.4%, down from