


FXOpen

GBP/USD started a fresh increase and traded above the 1.2700 resistance area. Conversely, USD/CAD declined heavily and broke the 1.3200 support area to enter a bearish zone.
Important Takeaways for GBP/USD and USD/CAD
- The British Pound started a solid upward move once it broke the 1.2600 resistance.
- There is a key bullish trend line forming with support near 1.2705 on the hourly chart of GBP/USD.
- USD/CAD started a major drop after it broke the key 1.3300 support area.
- The pair is facing a solid resistance near 1.3225 and a bearish trend line with resistance near 1.3240 on the hourly chart.
GBP/USD Technical Analysis
The British Pound found support near 1.2500 and 1.2510 against the US Dollar, and recently started a fresh increase this past week. The GBP/USD pair broke the 1.2550 and 1.2600 resistance levels to move into a positive zone.
The recent upward move was positive since there was a close above the 1.2650 level and the 50 hourly simple moving average. The pair even broke the 1.2700 level and recently traded close to the 1.2750 level on FXOpen.
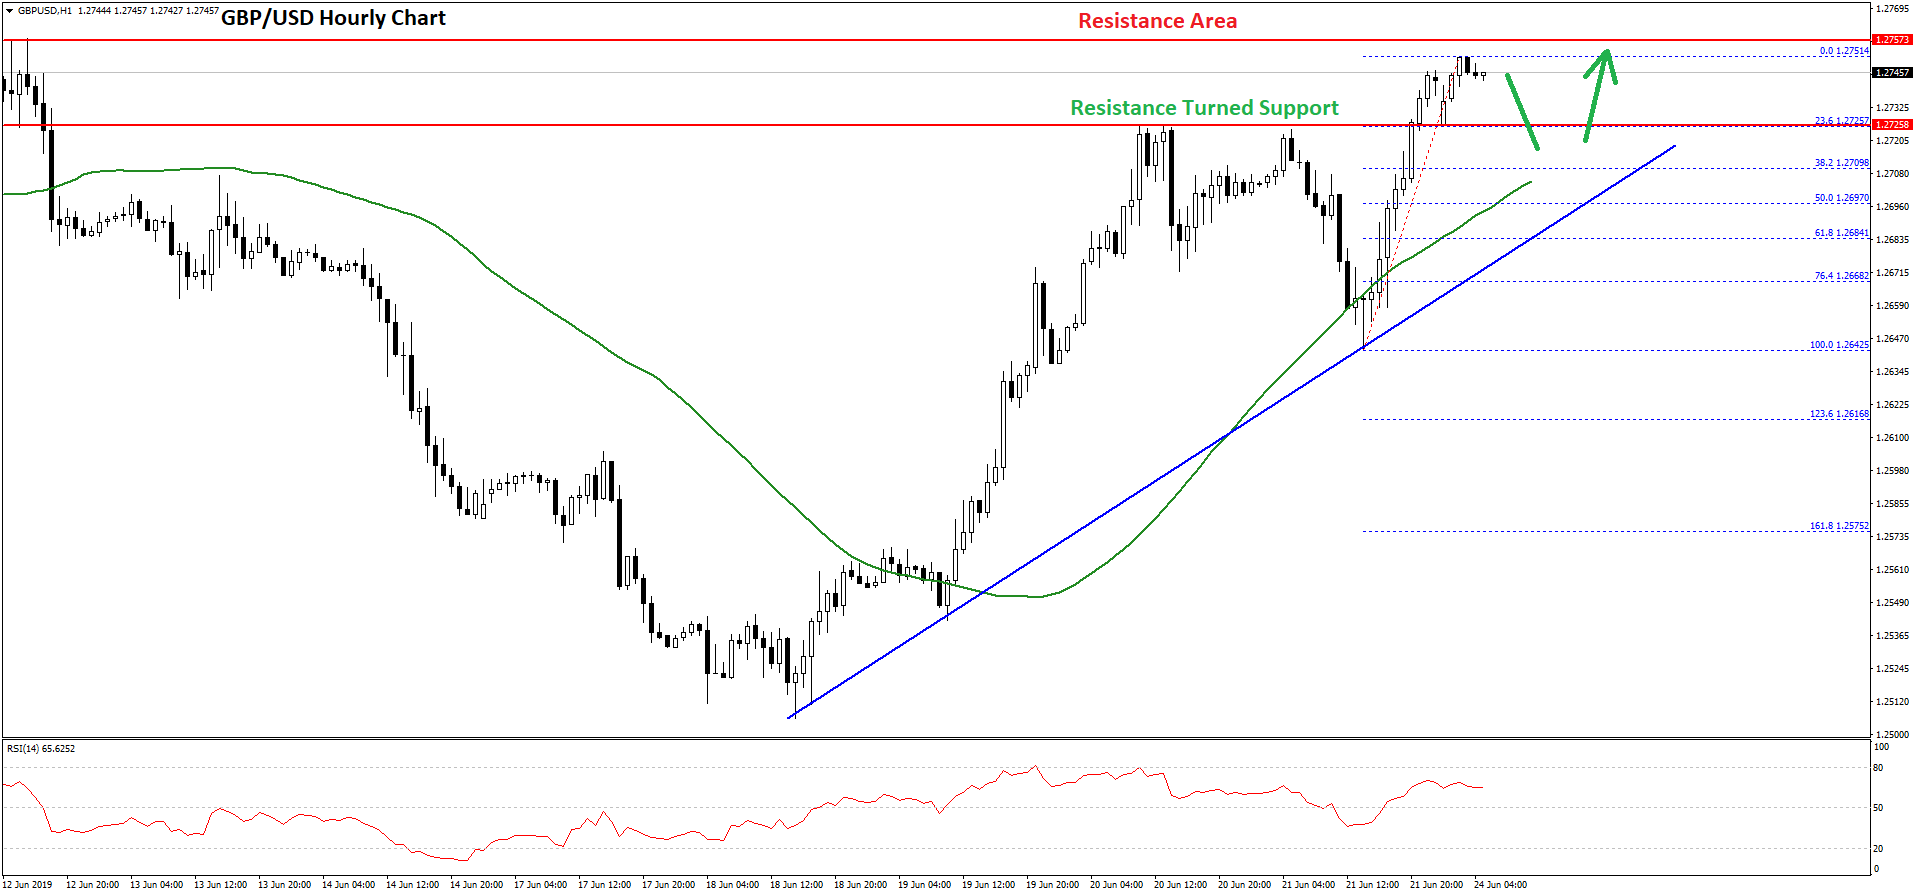
A swing high was formed at 1.2751 and the pair is currently consolidating gains. An initial support is near the 1.2725 level and the 23.6% Fib retracement level of the last wave from the 1.2642 low to 1.2751 high.
On the downside, there is a strong support formed near the 1.2700 level. There is also a key bullish trend line forming with support near 1.2705 on the hourly chart of GBP/USD.
The 50% Fib retracement level of the last wave from the 1.2642 low to 1.2751 high is near the 1.2697 level along with the 50 hourly SMA to provide support if the pair slides below 1.2725.
On the upside, an initial resistance is at 1.2750, above which the British Pound could continue to rise towards the 1.2800 resistance area in the coming sessions.
USD/CAD Technical Analysis
The US Dollar faced a strong resistance near the 1.3440 level against the Canadian Dollar. The USD/CAD pair started a major decline and broke the 1.3400 and 1.3360 support levels.
The decline gained pace after the broke the 1.3300 support levels and the 50 hourly simple moving average. It even broke the 1.3240 and 1.3200 support levels. A swing low was formed near 1.3150 and the price recently corrected higher.
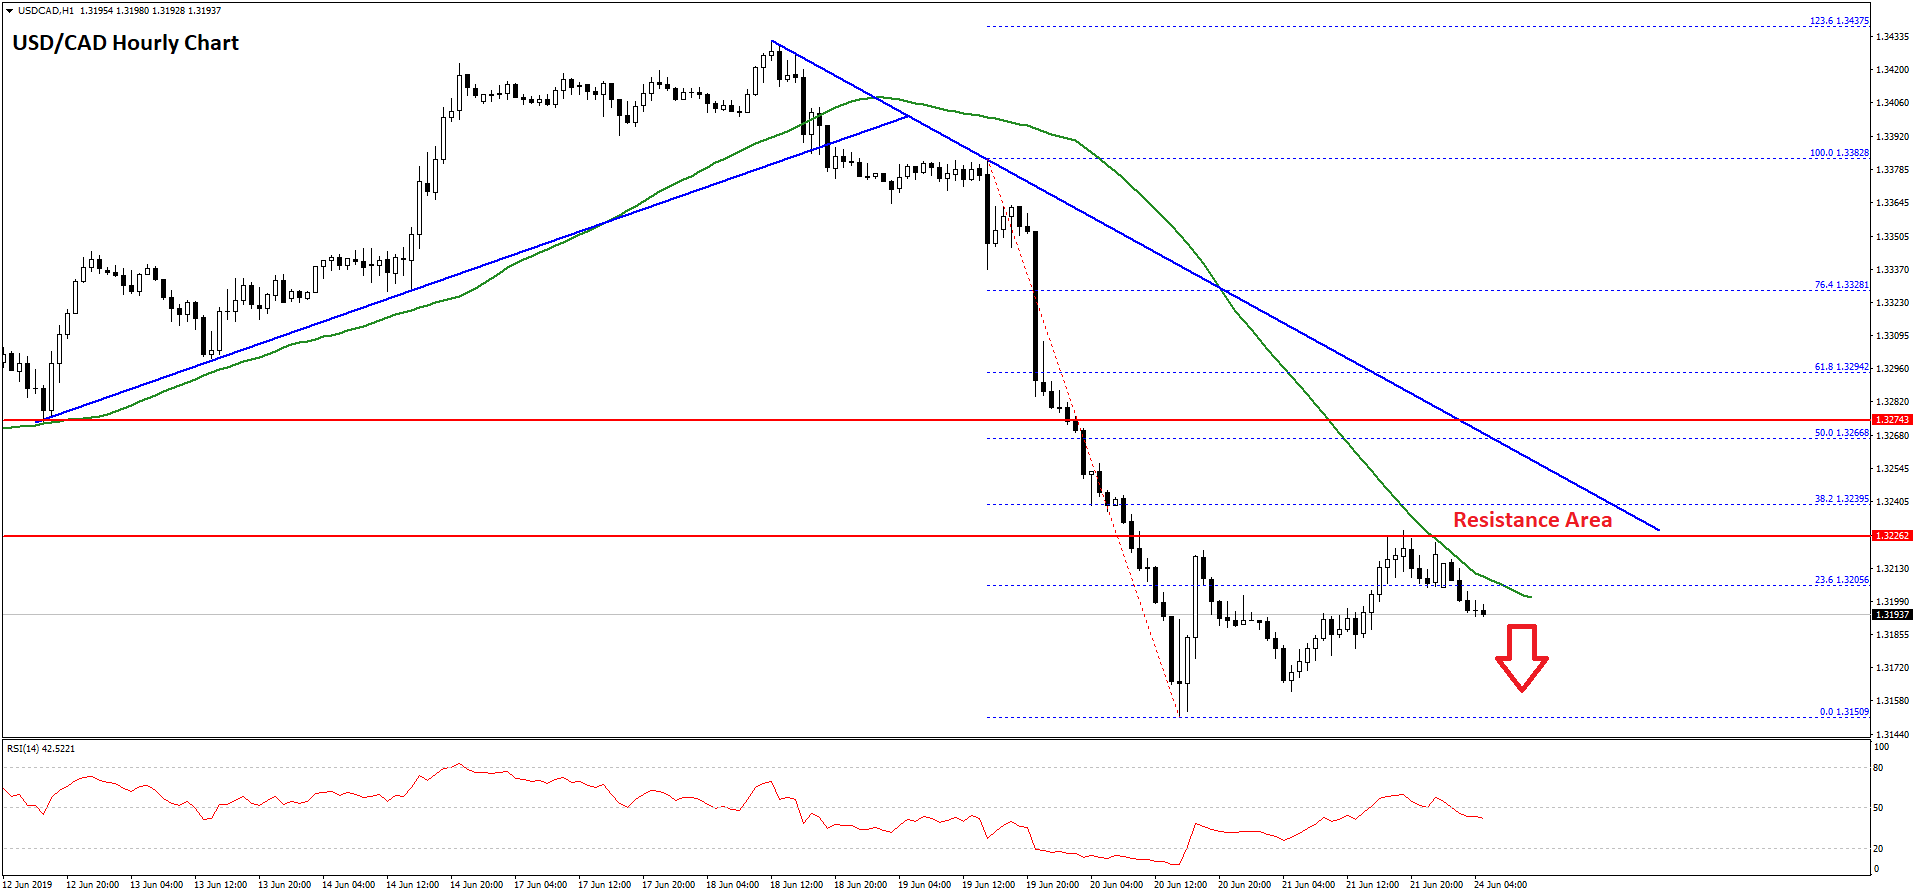
It recovered above the 1.3200 level and the 23.6% Fib retracement level of the last decline from the 1.3382 high to 1.3150 low.
However, the pair is currently struggling to clear the 1.3225 level and the 50 hourly simple moving average. Moreover, there is a bearish trend line forming with resistance near 1.3240 on the hourly chart.
The 38.2% Fib retracement level of the last decline from the 1.3382 high to 1.3150 low is close to the trend line resistance. Therefore, if the pair corrects higher, there are chances of it facing a lot of hurdles near the 1.3225 and 1.3240 levels.
If there is a break and close above 1.3240, the pair could start a decent upward move. The next key resistances are near 1.3280 and 1.3300.
On the downside, an initial support is near the 1.3180 level, below which the USD/CAD pair is likely to revisit the 1.3150 support level in the coming sessions. Below 1.3150, it might test 1.3120.
Trade over 50 forex markets 24 hours a day with FXOpen. Take advantage of low commissions, deep liquidity, and spreads from 0.0 pips. Open your FXOpen account now or learn more about trading forex with FXOpen.
This article represents the opinion of the Companies operating under the FXOpen brand only. It is not to be construed as an offer, solicitation, or recommendation with respect to products and services provided by the Companies operating under the FXOpen brand, nor is it to be considered financial advice.
Stay ahead of the market!
Subscribe now to our mailing list and receive the latest market news and insights delivered directly to your inbox.

Latest from Forex Analysis
Latest articles

Weekly Market Wrap With Gary Thomson: Nasdaq, EUR/USD, USD/CHF, Brent Crude Oil, Googl Shares
Get the latest scoop on the week's hottest headlines, all in one convenient video. Join Gary Thomson, the COO of FXOpen UK, as he breaks down the most significant news reports and shares his expert insights.
- Nasdaq Composite: Worst Session

Analysis of AUD/USD: Exchange Rate Falls to Early May Low
As indicated by the 4-hour AUD/USD chart today:
→ the rate fell below 0.652, a level last seen on May 2;
→ the RSI indicator dropped below 15, a level last seen during the panic over the spread of COVID-19

Analysis of AMZN Stock: Price at 1.5-Month Low
As shown in the AMZN chart, the stock price dropped below:
→ the psychological level of $180;
→ the mid-June interim low.
The last time AMZN traded below $180 was in early June.
Thus, AMZN has faced sell-offs, similar to other tech