


GBP/USD and USD/CAD: US Dollar Showing Signs of Weakness
FXOpen
GBP/USD gained pace this past week and recovered above the 1.2700 resistance. USD/CAD declined steadily below 1.3300, signaling short term US Dollar weakness.
Important Takeaways for GBP/USD and USD/CAD
- The British Pound started a decent recovery and recovered above 1.2700 and 1.2720.
- There is a major bullish trend line forming with support near 1.2710 on the hourly chart of GBP/USD.
- USD/CAD started a crucial decline and broke the key 1.3300 support area.
- The pair is currently trading well below 1.3300 and a bearish trend line with resistance near 1.3330 on the hourly chart.
GBP/USD Technical Analysis
The British Pound found support near 1.2550 and 1.2560 against the US Dollar, and started a fresh recovery this past week. The GBP/USD pair traded above the 1.2600 and 1.2650 resistance levels to move into a positive zone.
The pair even broke the 1.2700 resistance and the 50 hourly simple moving average. The bulls gained momentum above 1.2720 and a new swing high was formed near 1.2762 on FXOpen.
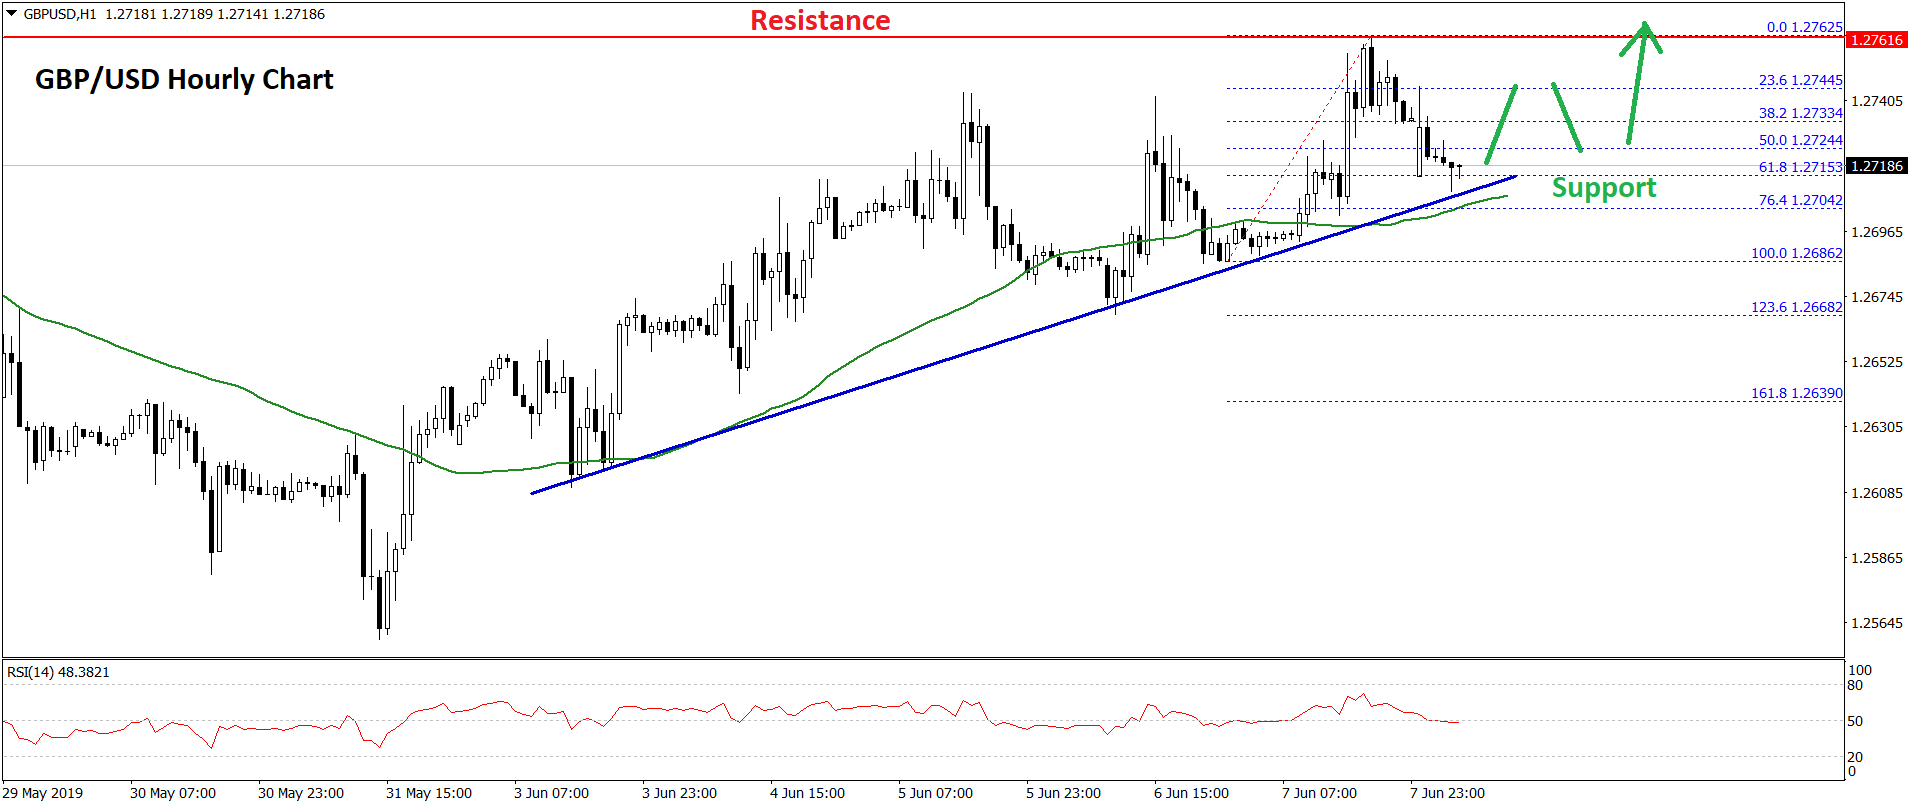
At the moment, the pair is correcting lower and it recently broke the 1.2750 level and the 50% Fib retracement level of the last wave from the 1.2686 low to 1.2762 high.
On the downside, there are many supports near the 1.2720 and 1.2700 levels. There is also a major bullish trend line forming with support near 1.2710 on the hourly chart of GBP/USD.
Moreover, the 61.8% Fib retracement level of the last wave from the 1.2686 low to 1.2762 high is likely to act as a strong support near 1.2720.
Therefore, if there is a downside correction, the pair could find support near the 1.2720 and 1.2700 levels. Only a close below 1.2700 and the 50 hourly SMA could push the pair back in a negative zone in the near term.
On the upside, an initial resistance is at 1.2750, above which the bulls could target 1.2780 or even 1.2800.
USD/CAD Technical Analysis
The US Dollar started a crucial downside move from well above the 1.3500 level against the Canadian Dollar. The USD/CAD pair gained bearish momentum below 1.3450 and 1.3400 support levels.
The recent decline was such that there was a close below the 1.3360 support area and the 50 hourly simple moving average. It even broke the 1.3300 level and traded as low as 1.3236.
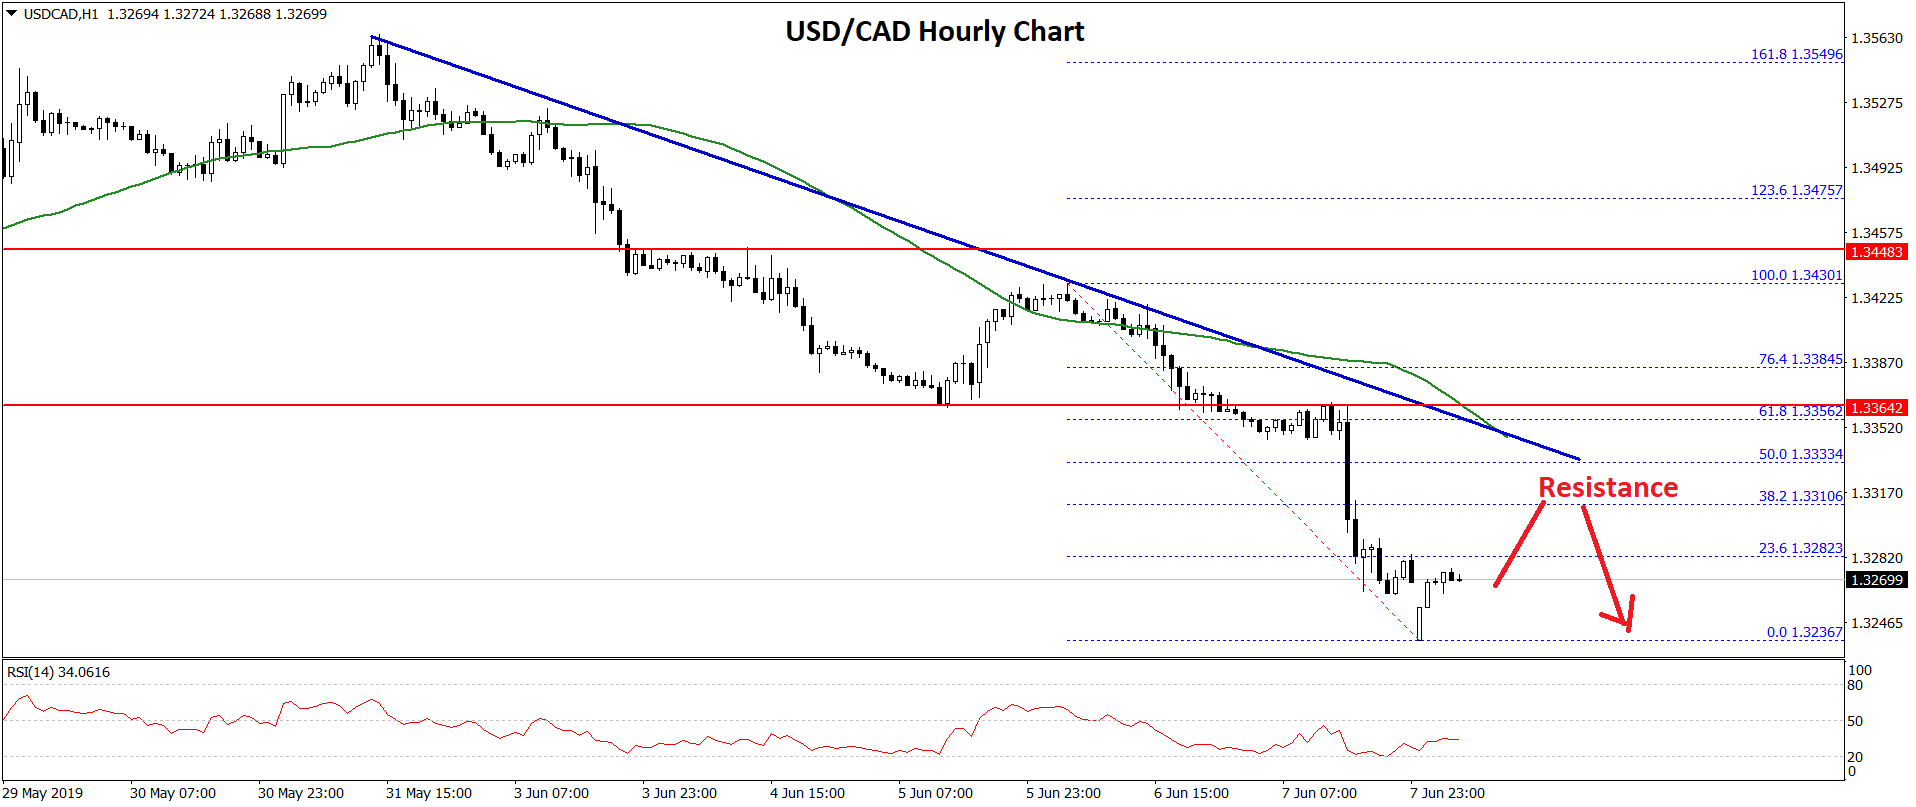
The current price action is super bearish, with an initial resistance at 1.3300 and 23.6% Fib retracement level of the last decline from the 1.3430 high to 1.3262 low.
On the upside, there is a bearish trend line in place with resistance near 1.3330 on the hourly chart. The trend line coincides with the 50% Fib retracement level of the last decline from the 1.3430 high to 1.3262 low.
The main resistance is near 1.3360 and the 50 hourly simple moving average. Therefore, as long as the pair is below the trend line, the 1.3360 level, and the 50 hourly SMA, there could be more downsides in the near term.
On the downside, an initial support is near the 1.3250 level, below which the USD/CAD pair is likely to accelerate towards the 1.3200 support level in the coming sessions.
Trade over 50 forex markets 24 hours a day with FXOpen. Take advantage of low commissions, deep liquidity, and spreads from 0.0 pips (additional fees may apply). Open your FXOpen account now or learn more about trading forex with FXOpen.
This article represents the opinion of the Companies operating under the FXOpen brand only. It is not to be construed as an offer, solicitation, or recommendation with respect to products and services provided by the Companies operating under the FXOpen brand, nor is it to be considered financial advice.
Stay ahead of the market!
Subscribe now to our mailing list and receive the latest market news and insights delivered directly to your inbox.


Latest articles

EUR/USD Eyes Gains As USD/CHF Weakness Deepens Again
EUR/USD started a fresh increase above 1.1700 and 1.1720. USD/CHF declined further and is now struggling below 0.7835.
Important Takeaways for EUR/USD and USD/CHF Analysis Today
· The Euro started a decent increase from

Apple: Earnings Day Above the Activity Zone
On 30 April, after the market close, Apple Inc. will release its financial results for the second quarter of fiscal 2026. The consensus forecast, based on estimates from 31 analysts, points to revenue of around $109.7 billion, with expected

USD/JPY and USD/CHF Near Key Levels: The Dollar Supported by the Fed
The US dollar continues to trend upwards following the Federal Reserve meeting, drawing support from the regulator’s moderately hawkish stance and comments by Jerome Powell. Markets interpret the Fed’s rhetoric as a signal that restrictive policy is likely