


FXOpen
GBP/USD bounced back sharply and broke the 1.2700 resistance. USD/CAD declined heavily and it broke the 1.3450 and 1.3400 support levels to move into a bearish zone.
Important Takeaways for GBP/USD and USD/CAD
- The British Pound recovered nicely and broke the 1.2700 pivot level.
- There was a break above a major bearish trend line with resistance at 1.2650 on the hourly chart of GBP/USD.
- USD/CAD declined below the 1.2450 and 1.2400 support levels to set the pace for more losses.
- The pair is following a crucial bearish trend line with resistance at 1.3425 on the hourly chart.
GBP/USD Technical Analysis
The British Pound found support near the 1.2445 level after a massive decline against the US Dollar. The GBP/USD pair started a solid recovery and moved above the 1.2550 and 1.2640 resistance levels.
The pair even close above the 1.2700 pivot level and 50 hourly simple moving average. Buyers pushed the pair further higher and a new intraday high was formed above the 1.2740 level on FXOpen.

During the rise, the pair broke many resistances, starting with 1.2640 and 1.2700. There was also a break above a major bearish trend line with resistance at 1.2650 on the hourly chart of GBP/USD. The pair even broke the 61.8% Fib retracement level of the last decline from the 1.2814 high to 1.2446 low.
The pair is now trading well above the 1.2720 level, the 50 hourly simple moving average, and the 76.4% Fib retracement level of the last decline from the 1.2814 high to 1.2446 low.
Therefore, there are chances of more gains towards the 1.2800 resistance levels in the near term. On the other hand, if there is a downside correction, the pair may find support near 1.2700 or 1.2680.
Overall, GBP/USD recovered nicely and the current price action indicates more gains above the 1.2750 and 1.2780 levels.
USD/CAD Technical Analysis
The US Dollar failed to break the key 1.3660-1.3670 resistance area against the Canadian Dollar. The USD/CAD pair started a major decline and broke the 1.3600, 1.3500 and 1.3450 support levels.
There was even a break below the 1.3400 support and the 50 hourly simple moving average. The pair traded below the 1.3380 level recently to move further into a bearish zone. Clearly, sellers are in control below 1.3400 and the 50 hourly simple moving average.
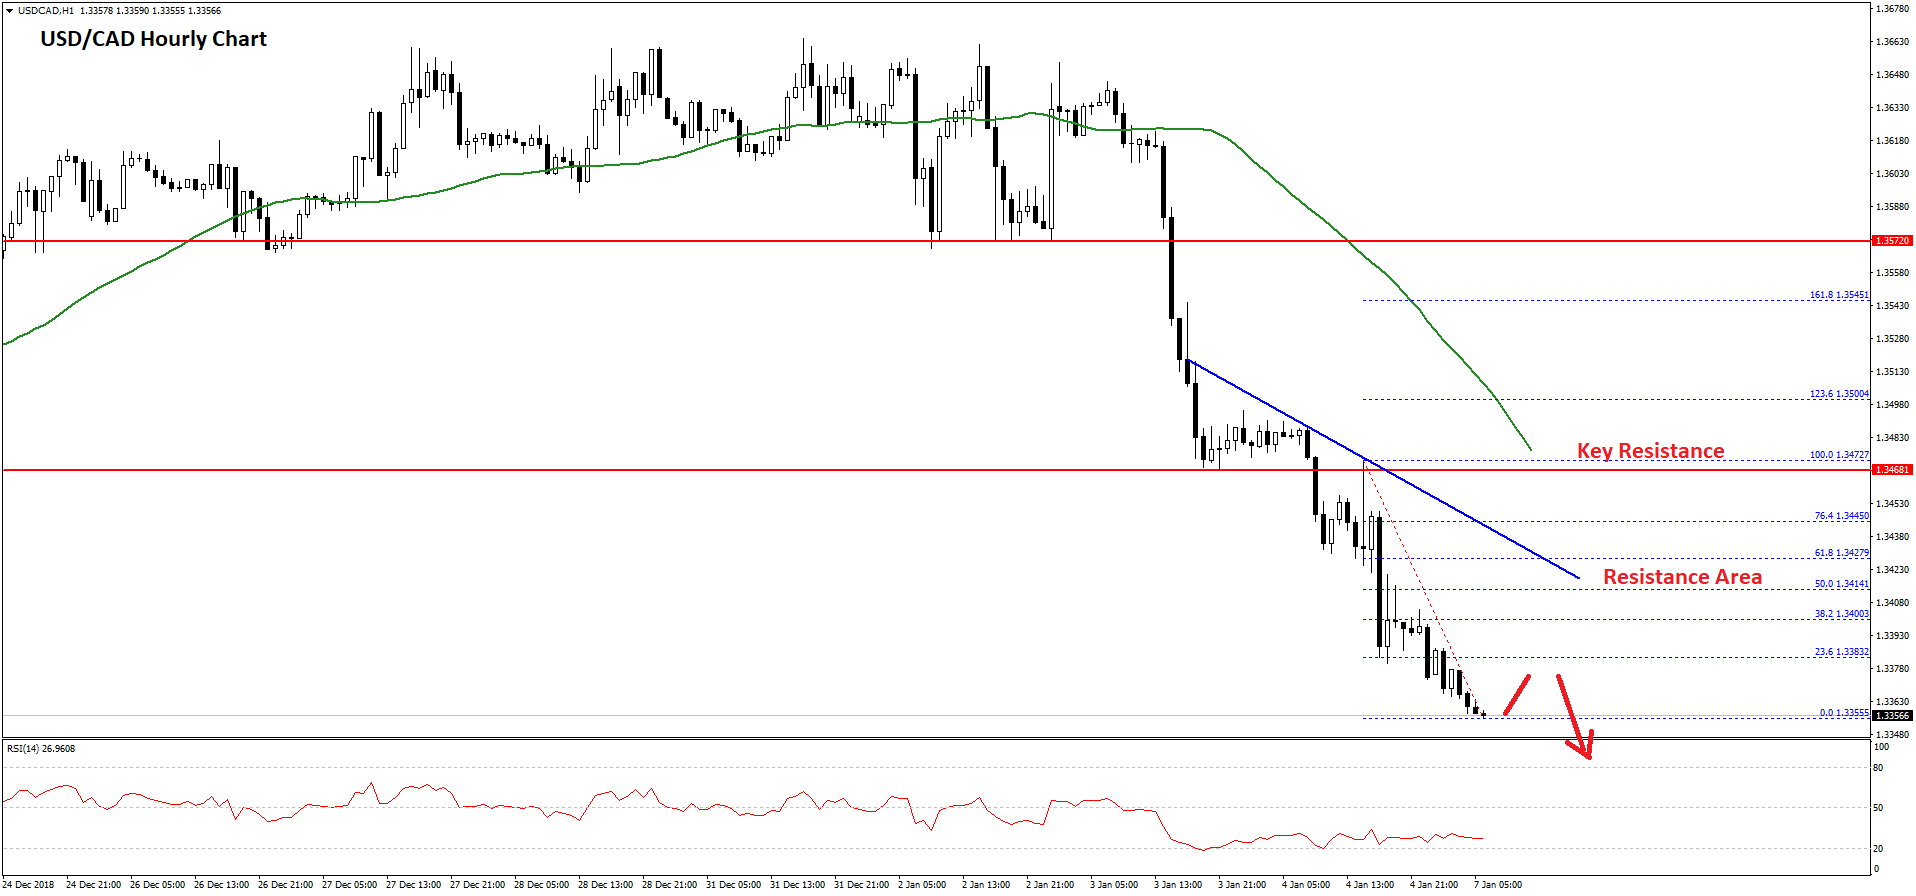
If there is a downside extension, the pair may trade towards the 1.3340 and 1.3310 support levels. On the other hand, if there is an upside correction, an initial resistance is near the 23.6% Fib retracement level of the recent decline from the 1.3472 high to 1.3355 low.
There is also a crucial bearish trend line in place with resistance at 1.3425 on the hourly chart. The trend line coincides with the 50% Fib retracement level of the recent decline from the 1.3472 high to 1.3355 low.
Therefore, if the pair corrects higher from the current levels, it is likely to face sellers near 1.3380, 1.3400 and 1.3425. A proper close above the 1.3425 level may push the price towards the 1.3470 resistance area. On the downside, the main supports are at 1.3350, 1.3320 and 1.3300.
Trade over 50 forex markets 24 hours a day with FXOpen. Take advantage of low commissions, deep liquidity, and spreads from 0.0 pips. Open your FXOpen account now or learn more about trading forex with FXOpen.
This article represents the opinion of the Companies operating under the FXOpen brand only. It is not to be construed as an offer, solicitation, or recommendation with respect to products and services provided by the Companies operating under the FXOpen brand, nor is it to be considered financial advice.
Stay ahead of the market!
Subscribe now to our mailing list and receive the latest market news and insights delivered directly to your inbox.

Latest from Forex Analysis
Latest articles

Weekly Market Wrap With Gary Thomson: Nasdaq, EUR/USD, USD/CHF, Brent Crude Oil, Googl Shares
Get the latest scoop on the week's hottest headlines, all in one convenient video. Join Gary Thomson, the COO of FXOpen UK, as he breaks down the most significant news reports and shares his expert insights.
- Nasdaq Composite: Worst Session

Analysis of AUD/USD: Exchange Rate Falls to Early May Low
As indicated by the 4-hour AUD/USD chart today:
→ the rate fell below 0.652, a level last seen on May 2;
→ the RSI indicator dropped below 15, a level last seen during the panic over the spread of COVID-19

Analysis of AMZN Stock: Price at 1.5-Month Low
As shown in the AMZN chart, the stock price dropped below:
→ the psychological level of $180;
→ the mid-June interim low.
The last time AMZN traded below $180 was in early June.
Thus, AMZN has faced sell-offs, similar to other tech