


FXOpen
GBP/USD recovered nicely and broke the 1.2840 and 1.2880 resistance levels. USD/CAD is under bearish pressure and it could revisit the 1.3200 support area.
Important Takeaways for GBP/USD and USD/CAD
- The British Pound found support near 1.2770 and later recovered above the 1.2840 resistance.
- There is a key connecting bearish trend line formed with resistance at 1.2935 on the hourly chart of GBP/USD.
- USD/CAD declined sharply and broke the 1.3300 and 1.3260 support levels.
- There was a break below a major bullish trend line at 1.3265 on the hourly chart.
GBP/USD Technical Analysis
The British Pound declined steadily this past week from the 1.2980 swing high against the US Dollar. The GBP/USD pair broke the 1.2850 and 1.2800 support levels before buyers appeared near the 1.2770 level.
A low was formed at 1.2773 on FXOpen and later the pair started an upside correction. It moved nicely above the 1.2840 resistance and the 50% Fib retracement level of the last decline from the 1.2958 high to 1.2773 low.
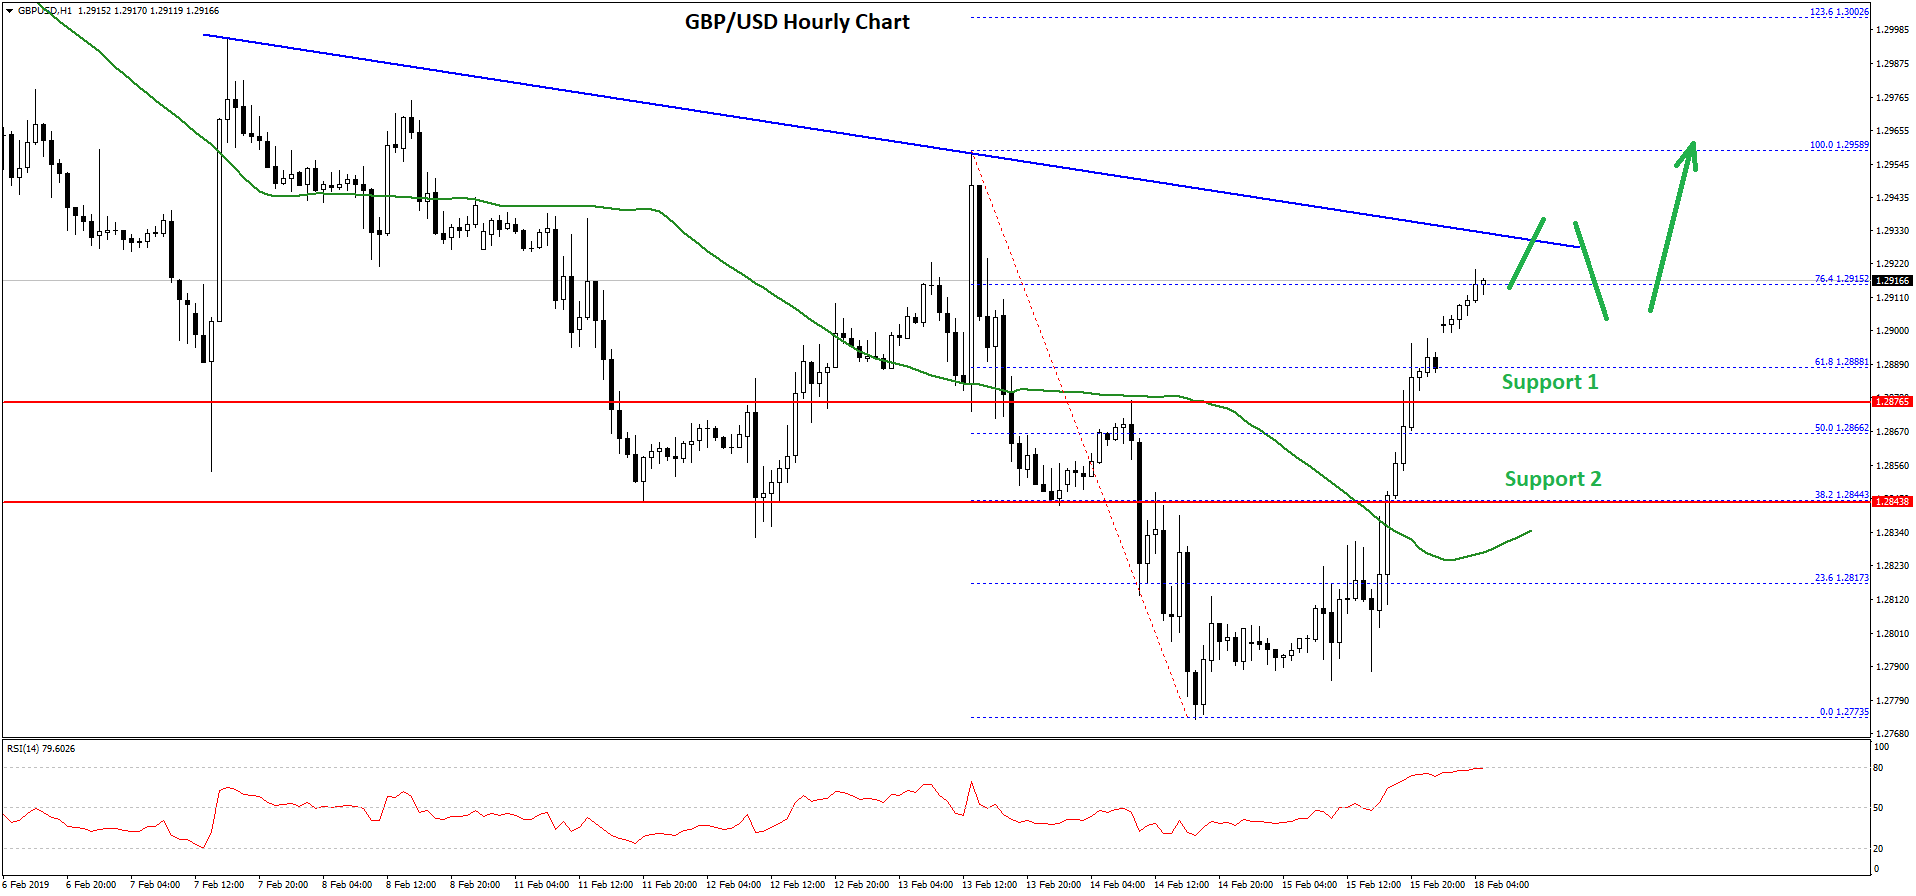
Moreover, there was a break above the 1.2880 resistance and the 50 hourly simple moving average. It opened the doors for more gains and the pair traded above the 1.2900 resistance level.
At the moment, the pair is testing the 1.2915 resistance and the 76.4% Fib retracement level of the last decline from the 1.2958 high to 1.2773 low. More importantly, there is a key connecting bearish trend line formed with resistance at 1.2935 on the hourly chart of GBP/USD.
Therefore, there could be a short term downside correction towards the 1.2880 level in the near term. The current price action is positive and if there is a downside correction, buyers are likely to protect dips near the 1.2880 level.
The next key support is near the 1.2840 level and the 50 hourly simple moving average. On the upside, a break above the bearish trend line and 1.2940 could push the price towards the 1.2980 and 1.3000 levels.
USD/CAD Technical Analysis
The US Dollar was rejected near the 1.3340 level against the Canadian Dollar. The USD/CAD pair started a major downside move and broke the key supports near 1.3300 and 1.3280 levels.
The decline was such that the pair broke the 1.3260 support and the 50 hourly simple moving average. Moreover, there was a break below the 61.8% Fib retracement level of the last wave from the 1.3196 low to 1.3339 high.
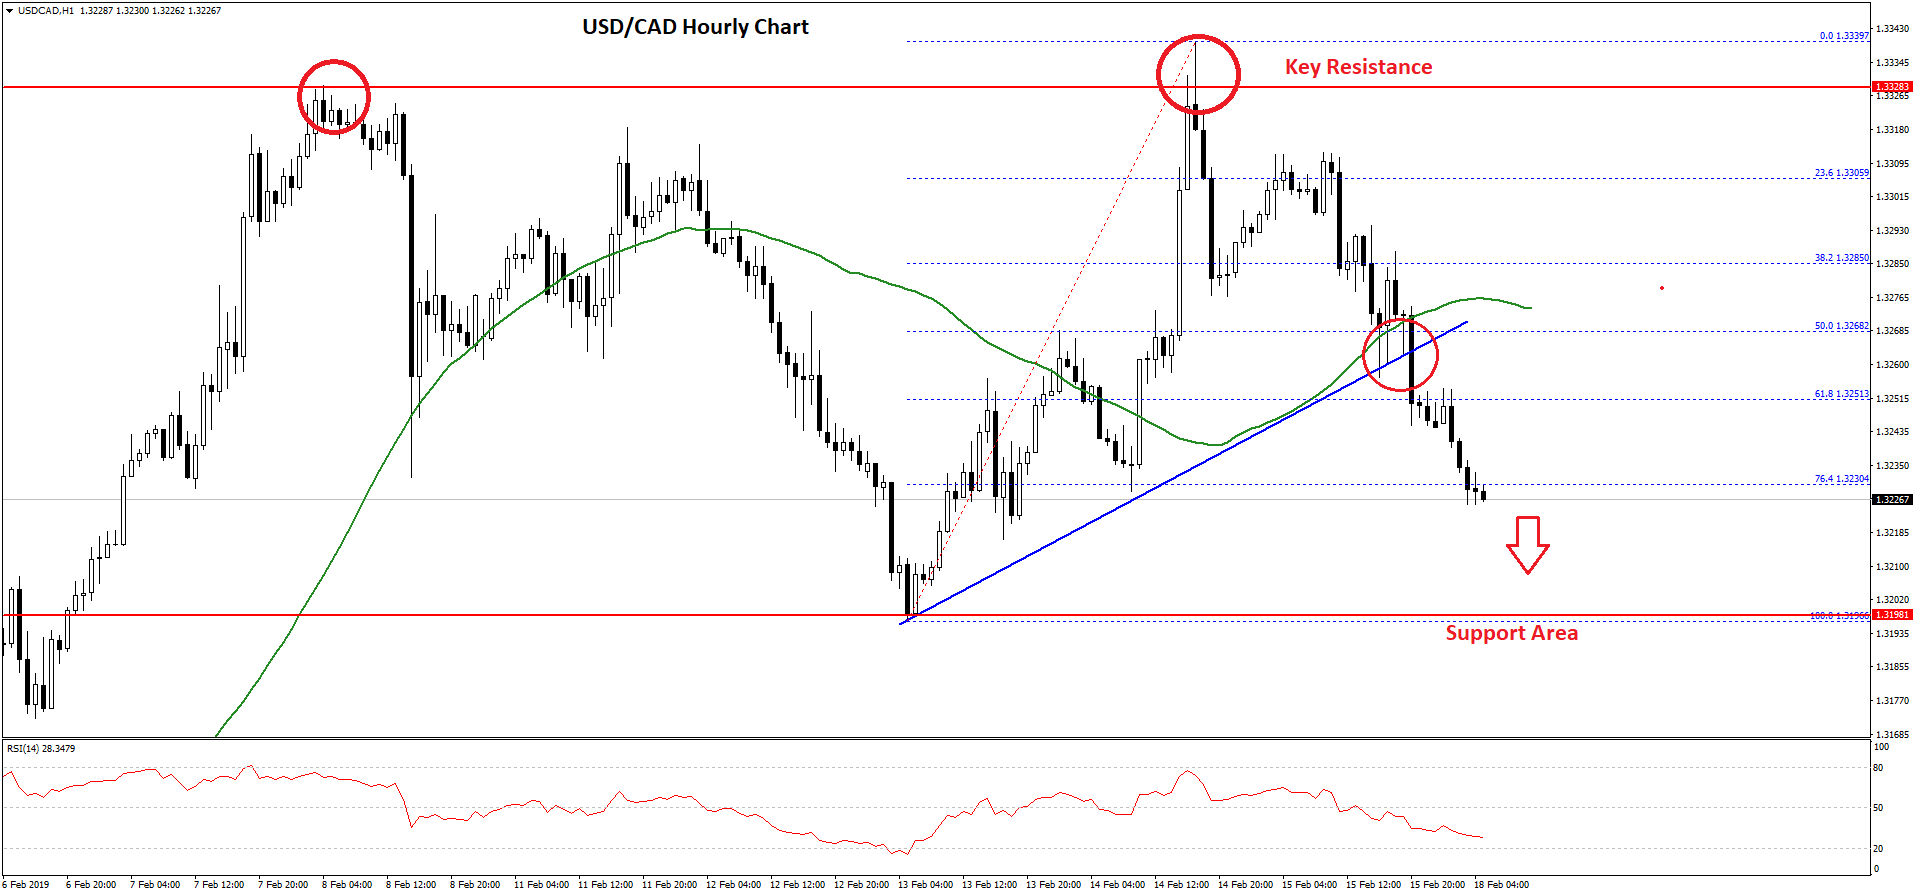
Additionally, there the pair surpassed a major bullish trend line at 1.3265 on the hourly chart, opening the doors for more losses. The pair is now trading well below 1.3250 level and the 76.4% Fib retracement level of the last wave from the 1.3196 low to 1.3339 high.
Therefore, there are high chances that the pair could continue to move down towards the 1.3196 swing low or the 1.3200 support area.
On the upside, an initial resistance is near the 1.3250 level. However, the main resistance is near the 1.3270 level and the 50 hourly simple moving average.
In the short term, if there is an upside correction, sellers are likely to protect the 1.3260-1.3270 area. On the downside, the main target for sellers could be 1.3200, below which it might slide towards the 1.3175 level.
Trade over 50 forex markets 24 hours a day with FXOpen. Take advantage of low commissions, deep liquidity, and spreads from 0.0 pips. Open your FXOpen account now or learn more about trading forex with FXOpen.
This article represents the opinion of the Companies operating under the FXOpen brand only. It is not to be construed as an offer, solicitation, or recommendation with respect to products and services provided by the Companies operating under the FXOpen brand, nor is it to be considered financial advice.
Stay ahead of the market!
Subscribe now to our mailing list and receive the latest market news and insights delivered directly to your inbox.

Latest from Forex Analysis
Latest articles

Weekly Market Wrap With Gary Thomson: Nasdaq, EUR/USD, USD/CHF, Brent Crude Oil, Googl Shares
Get the latest scoop on the week's hottest headlines, all in one convenient video. Join Gary Thomson, the COO of FXOpen UK, as he breaks down the most significant news reports and shares his expert insights.
- Nasdaq Composite: Worst Session

Analysis of AUD/USD: Exchange Rate Falls to Early May Low
As indicated by the 4-hour AUD/USD chart today:
→ the rate fell below 0.652, a level last seen on May 2;
→ the RSI indicator dropped below 15, a level last seen during the panic over the spread of COVID-19

Analysis of AMZN Stock: Price at 1.5-Month Low
As shown in the AMZN chart, the stock price dropped below:
→ the psychological level of $180;
→ the mid-June interim low.
The last time AMZN traded below $180 was in early June.
Thus, AMZN has faced sell-offs, similar to other tech