


GBP/USD Consolidating, USD/CAD Rally Above 1.3550
FXOpen
GBP/USD recovered recently, but it faced a strong resistance near the 1.2700 level. USD/CAD remains in a solid uptrend and it recently broke the 1.3550 resistance area.
Important Takeaways for GBP/USD and USD/CAD
- The British Pound recovered above the 1.2600 and 1.2660 resistance levels.
- There is a major bullish trend line formed with support at 1.2625 on the hourly chart of GBP/USD.
- USD/CAD recently climbed above the 1.2500, 1.2550 and 1.2580 resistance levels.
- The pair is following two bullish trend lines with support at 1.3545 and 1.3490 on the hourly chart.
GBP/USD Technical Analysis
The British Pound started consolidating in a range above the 1.2500 level this past week against the US Dollar. Later, the GBP/USD pair started a decent recovery and moved above the 1.2600 and 1.2660 resistance levels.
The pair even settled above the 1.2660 level and the 50 hourly simple moving average. However, the pair struggled a lot to break the 1.2700 resistance area and it recently formed a high at 1.2705 on FXOpen.
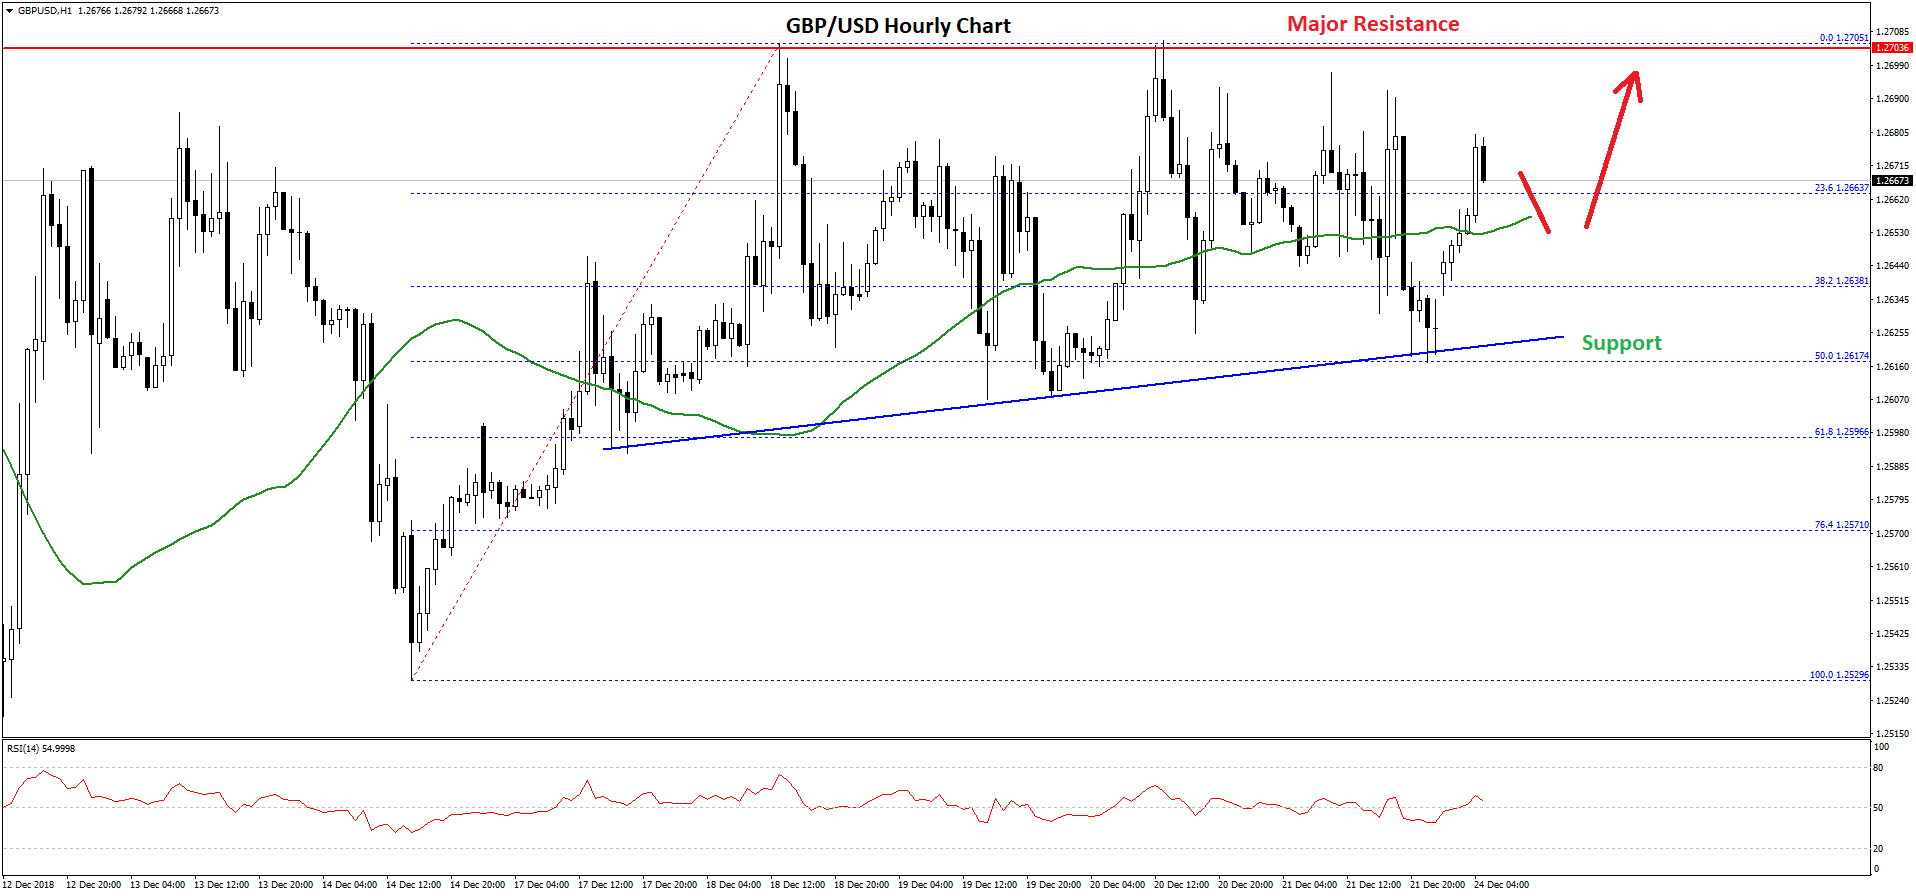
The pair corrected lower below 1.2680 and the 38.2% Fib retracement level of the recent wave from the 1.2529 low to 1.2705 high. However, there is a strong support formed near the 1.2600-1.2620 zone.
Buyers also defended the 50% Fib retracement level of the recent wave from the 1.2529 low to 1.2705 high. Moreover, there is a major bullish trend line formed with support at 1.2625 on the hourly chart of GBP/USD.
As long as the pair is above the trend line and 1.2600, it could make another attempt to break the 1.2700 resistance area. A successful close above the 1.2700 barrier may start a decent upward move towards the 1.2800 resistance in the near term.
Overall, GBP/USD is currently consolidating in a major range and it is likely preparing for the next key break either above 1.2700 or below 1.2620.
USD/CAD Technical Analysis
The US Dollar remained in a solid uptrend from the 1.3320 swing low against the Canadian Dollar. The USD/CAD pair climbed above the 1.3400 and 1.3480 resistance levels to move into a positive zone.
Later, there was a break above the 1.2550 resistance zone, which cleared the path for more gains. The pair traded close to the 1.2600 level and formed a high at 1.2599. At the moment, the pair is correcting lower and broke the 1.3580 level.
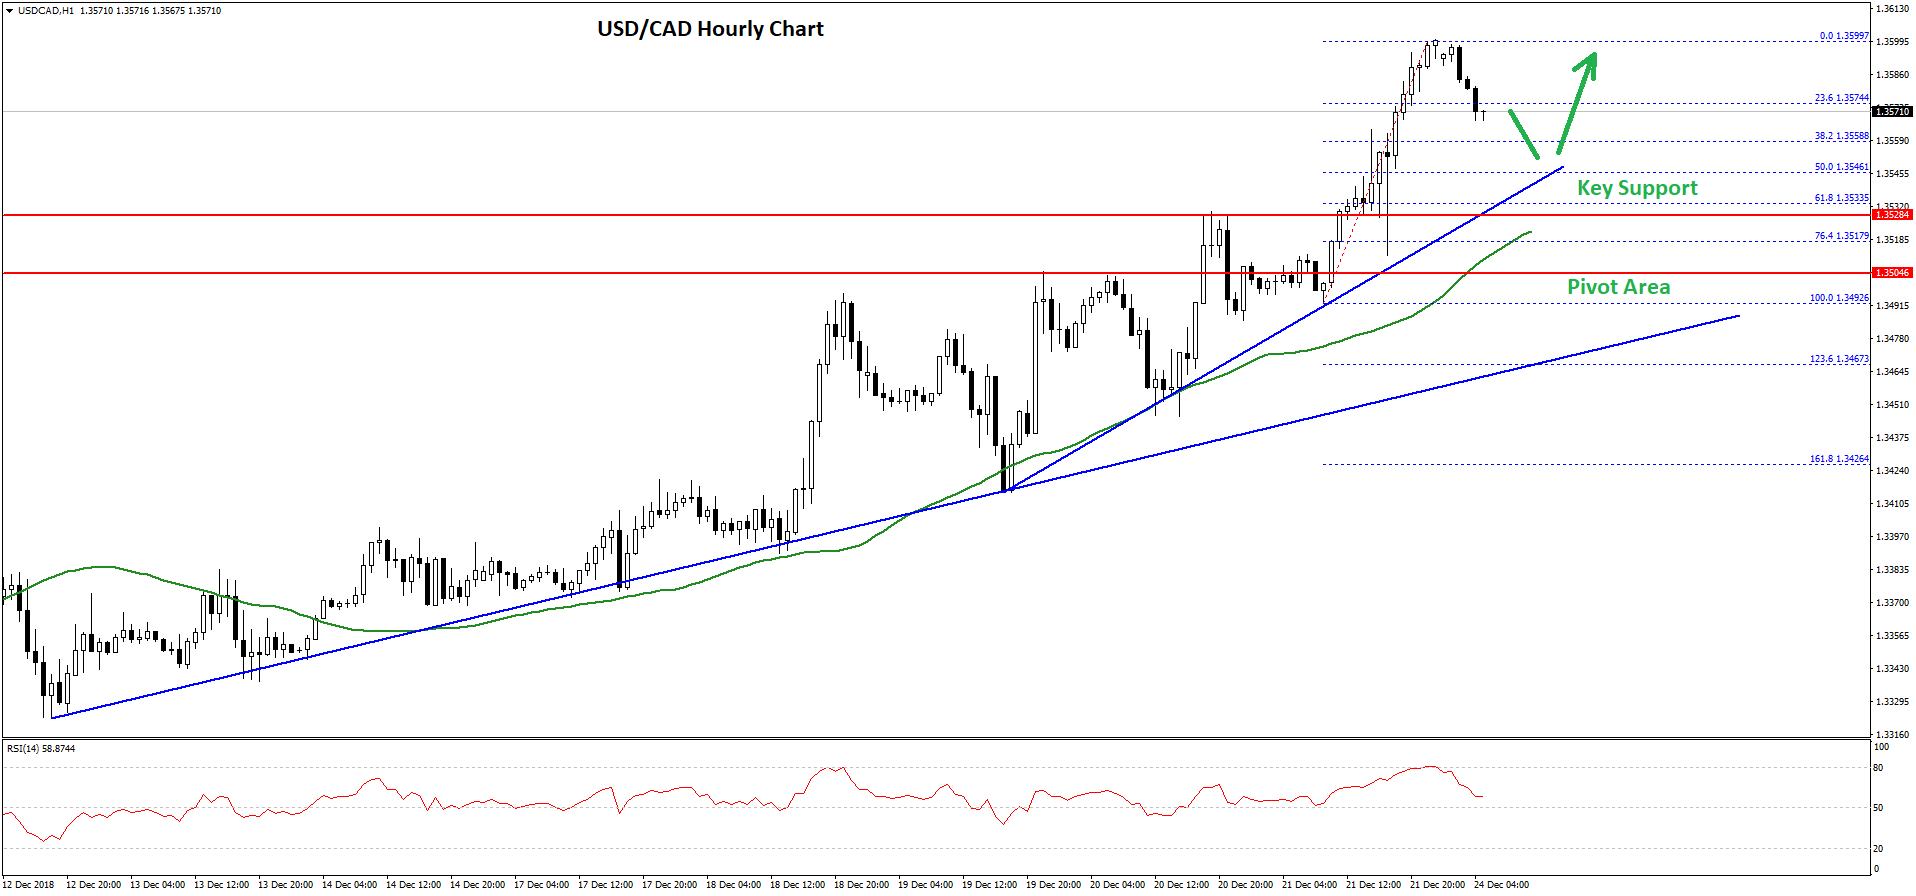
Sellers pushed the pair below the 23.6% Fib retracement level of the recent wave from the 1.3492 low to 1.3599 high. However, the pair remains well supported on the downside near the 1.3540 level and the 50 hourly simple moving average.
Besides, there are two bullish trend lines in place with support at 1.3545 and 1.3490 on the hourly chart. The first trend line coincides with the 50% Fib retracement level of the recent wave from the 1.3492 low to 1.3599 high.
Should there be a break below the first trend line and the 1.3540 support, the pair could test the 1.3500 pivot area. The overall trend is very positive for USD/CAD and it seems like the pair could resume its upward move after a short term downside correction towards the 1.3540 or 1.3500 supports.
Trade over 50 forex markets 24 hours a day with FXOpen. Take advantage of low commissions, deep liquidity, and spreads from 0.0 pips (additional fees may apply). Open your FXOpen account now or learn more about trading forex with FXOpen.
This article represents the opinion of the Companies operating under the FXOpen brand only. It is not to be construed as an offer, solicitation, or recommendation with respect to products and services provided by the Companies operating under the FXOpen brand, nor is it to be considered financial advice.
Stay ahead of the market!
Subscribe now to our mailing list and receive the latest market news and insights delivered directly to your inbox.


Latest articles

EUR/USD Eyes Gains As USD/CHF Weakness Deepens Again
EUR/USD started a fresh increase above 1.1700 and 1.1720. USD/CHF declined further and is now struggling below 0.7835.
Important Takeaways for EUR/USD and USD/CHF Analysis Today
· The Euro started a decent increase from

Apple: Earnings Day Above the Activity Zone
On 30 April, after the market close, Apple Inc. will release its financial results for the second quarter of fiscal 2026. The consensus forecast, based on estimates from 31 analysts, points to revenue of around $109.7 billion, with expected

USD/JPY and USD/CHF Near Key Levels: The Dollar Supported by the Fed
The US dollar continues to trend upwards following the Federal Reserve meeting, drawing support from the regulator’s moderately hawkish stance and comments by Jerome Powell. Markets interpret the Fed’s rhetoric as a signal that restrictive policy is likely