


GBP/USD Could Continue Higher, USD/CAD Facing Hurdles
FXOpen
GBP/USD rallied in the past few days above the 1.3300 and 1.3400 resistance levels. USD/CAD is currently correcting higher, but it is facing hurdles near 1.3200.
Important Takeaways for GBP/USD and USD/CAD
- The British Pound is trading with a solid bullish bias above the 1.3200 and 1.3300 levels.
- There is a connecting bullish trend line forming with support near 1.3360 on the hourly chart of GBP/USD.
- USD/CAD is currently trading in a bearish zone below the 1.3200 resistance area
- There are two major bearish trend lines forming with resistance near 1.3200 on the hourly chart.
GBP/USD Technical Analysis
This past week, the British Pound started a strong increase above the 1.3200 resistance area against the US Dollar. The GBP/USD pair even surged above the 1.3300 level to move into a positive zone.
Moreover, there was a sharp rally above the 1.3400 level and the 50 hourly simple moving average. It opened the doors for more gains above the 1.3500 level. Finally, the pair traded as high as 1.3513 on FXOpen before starting a downside correction.
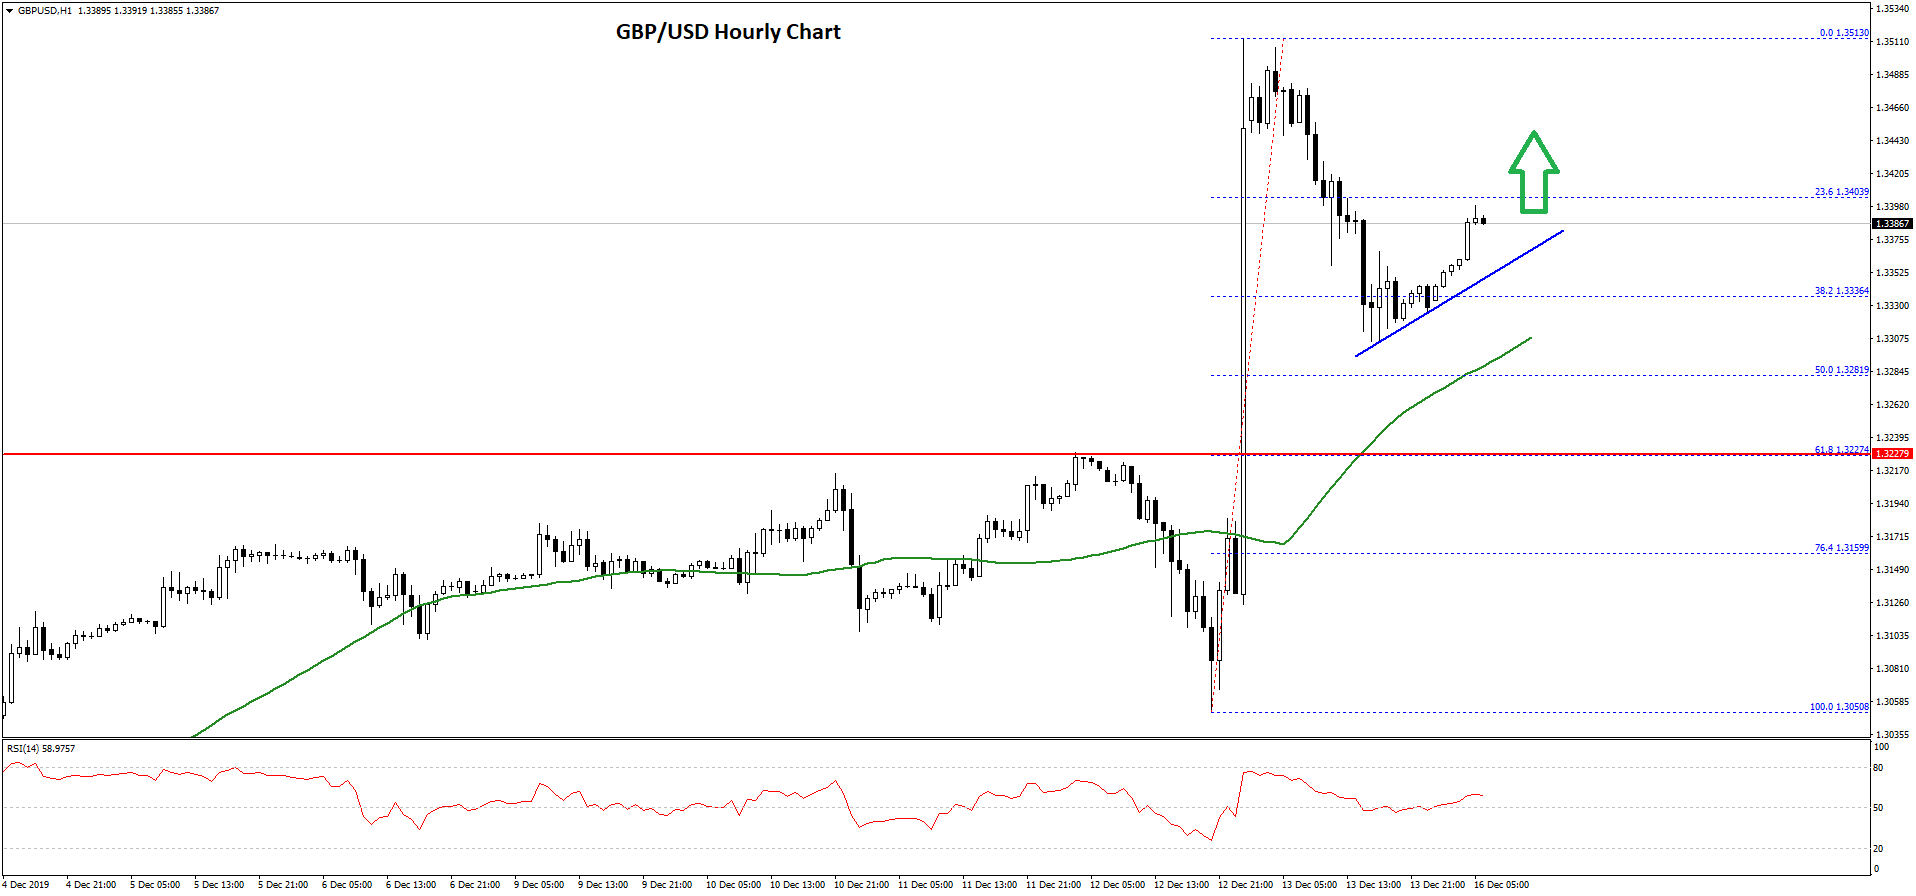
The pair corrected lower below the 1.3400 support area. Besides, there was a break below the 23.6% Fib retracement level of the last wave from the 1.3050 low to 1.3513 high.
The correction was such that the pair even corrected below the 1.3350 level. It spiked below the 38.2% Fib retracement level of the last wave from the 1.3050 low to 1.3513 high.
However, the 1.3300-1.3310 area acted as a decent support. At the moment, there is a connecting bullish trend line forming with support near 1.3360 on the hourly chart of GBP/USD.
The pair is trading nicely above 1.3350 and it seems like it could continue to rise above the 1.3400 level. An immediate resistance is near the 1.3420 level, above which the pair could continue to climb towards the 1.3500 area.
Conversely, if there is a downside break below the trend line and 1.3350, the pair could retest the 1.3300 support area in the near term.
USD/CAD Technical Analysis
The US Dollar followed a bearish path below the 1.3300 and 1.3250 levels against the Canadian Dollar. Besides, the USD/CAD pair settled below the 1.3200 support area.
It even traded below the 50 hourly simple moving average and 1.3160. A low was formed near 1.3150 and the pair is currently correcting higher.
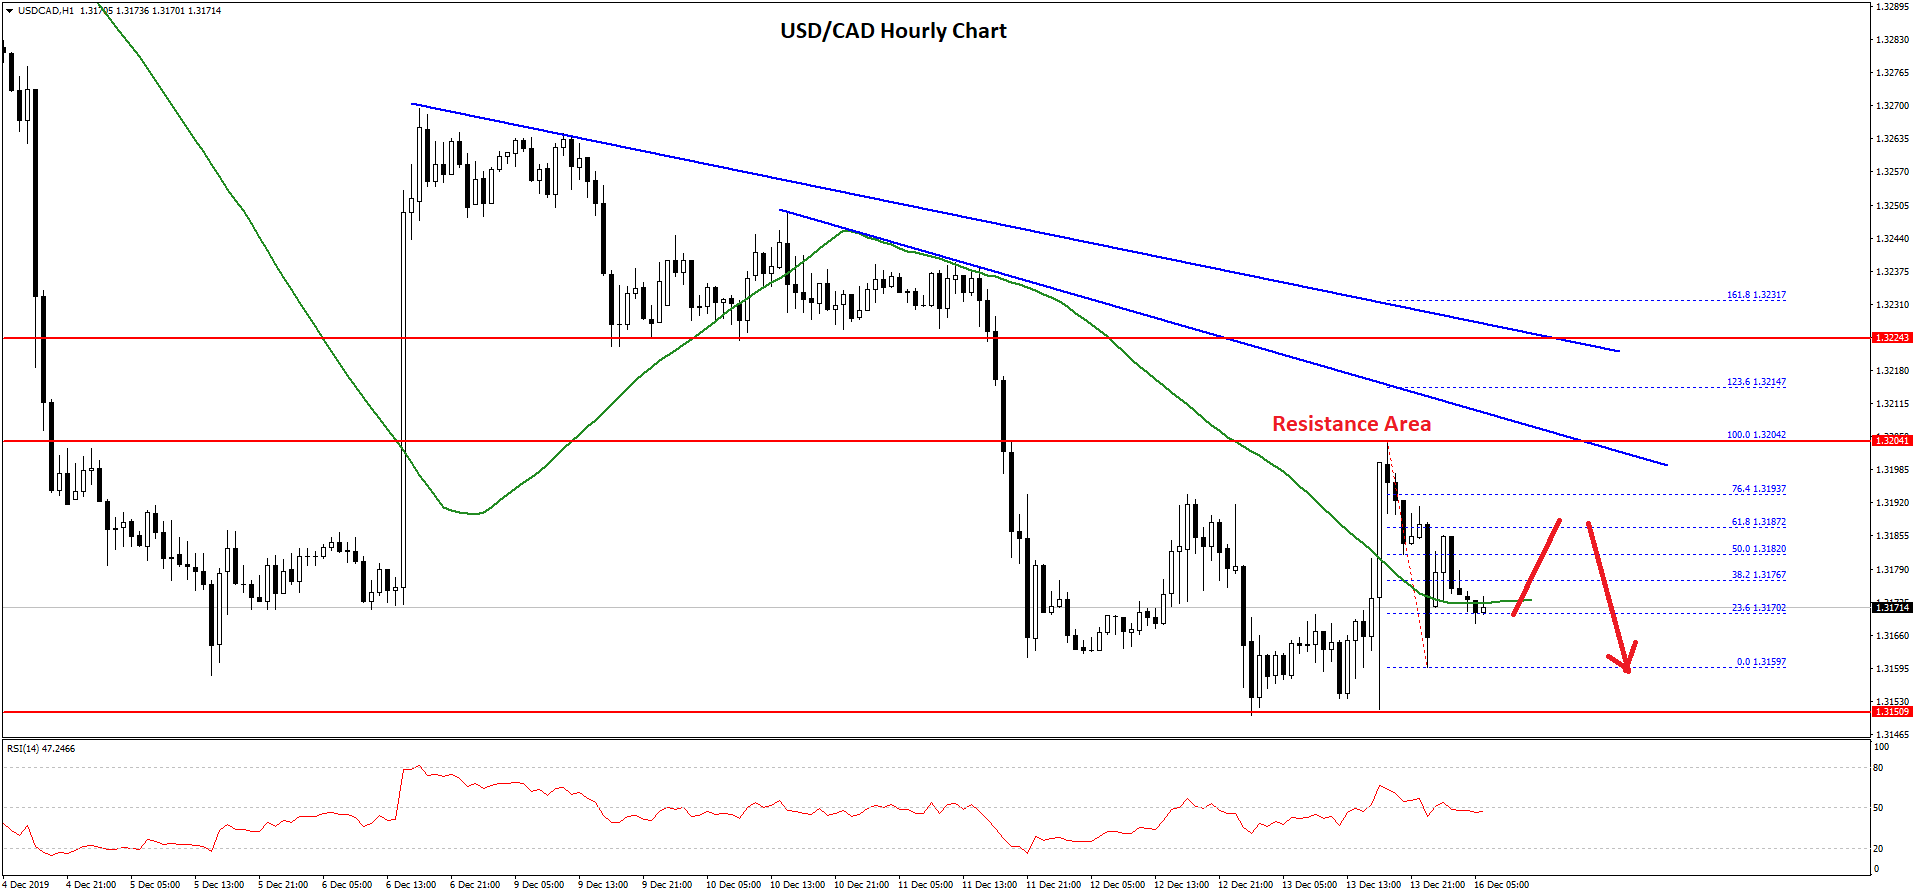
It recently tested the 1.3180 resistance area, plus the 50% Fib retracement level of the latest decline from the 1.3204 high to 1.3159 low. On the upside, there are many resistances near 1.3180 and 1.3200.
More importantly, there are two major bearish trend lines forming with resistance near 1.3200 on the hourly chart. Above the trend lines, the pair could start a strong rise in the coming sessions.
The next major resistance is near the 1.3220 and 1.3240 levels. Any further gains could push the pair towards the 1.3300 level.
On the downside, the pair might find bids near the 1.3160 and 1.3150 levels. If USD/CAD fails to stay above 1.3150, there is a risk of another bearish wave. The next major supports are seen near the 1.3120 and 1.3100 levels.
Any further losses may perhaps lead the pair towards the 1.3050 support area in the near term.
Trade over 50 forex markets 24 hours a day with FXOpen. Take advantage of low commissions, deep liquidity, and spreads from 0.0 pips (additional fees may apply). Open your FXOpen account now or learn more about trading forex with FXOpen.
This article represents the opinion of the Companies operating under the FXOpen brand only. It is not to be construed as an offer, solicitation, or recommendation with respect to products and services provided by the Companies operating under the FXOpen brand, nor is it to be considered financial advice.
Stay ahead of the market!
Subscribe now to our mailing list and receive the latest market news and insights delivered directly to your inbox.


Latest articles

EUR/USD and GBP/USD consolidate ahead of the Fed decision
European currencies are showing subdued dynamics, entering a consolidation phase following their previous advance. Earlier, EUR/USD and GBP/USD broke out of their ranges and strengthened; however, the subsequent correction has led both pairs to retest the previously breached

Meta: V-Shaped Recovery Meets Heavy Volume Resistance
The movement in Meta Platforms shares is being driven by two competing narratives. On one hand, advertising revenue is benefiting from AI-based tools: the Advantage+ platform continues to support strong advertiser demand, and the analyst consensus for Q1 2026 revenue

Commodity Currencies Test Key Levels Ahead of Major Macro Data
Commodity-linked currencies are trading near key levels, showing restrained price action as market participants adopt a wait-and-see approach. The fundamental backdrop is shaped by expectations surrounding the release of Australia’s inflation data and the Bank of Canada’s interest