


GBP/USD Could Extend Correction, USD/CAD May Dip Slightly
FXOpen
GBP/USD gained a lot of momentum recently and tested the 1.3000 resistance area. USD/CAD is currently consolidating, but it may start a fresh upward move after a tiny downside correction.
Important Takeaways for GBP/USD and USD/CAD
- The British Pound rallied recently above the 1.2800 and 1.2920 resistance levels.
- Recently, there was a downside correction below a major bullish trend line with support at 1.2885 on the hourly chart of GBP/USD.
- USD/CAD is trading nicely above the 1.3250 and 1.3240 support levels.
- There is a breakout pattern formed with resistance at 1.3275 on the hourly chart.
GBP/USD Technical Analysis
The British Pound found started a sharp upward move from the 1.2700 support area against the US Dollar. The GBP/USD pair traded above the 1.2800, 1.2850 and 1.2920 resistance levels.
The upward move was strong as the pair even broke the 1.2950 resistance and tested the 1.3000 resistance. A high was formed at 1.3000 on FXOpen and later the pair started a downside correction.
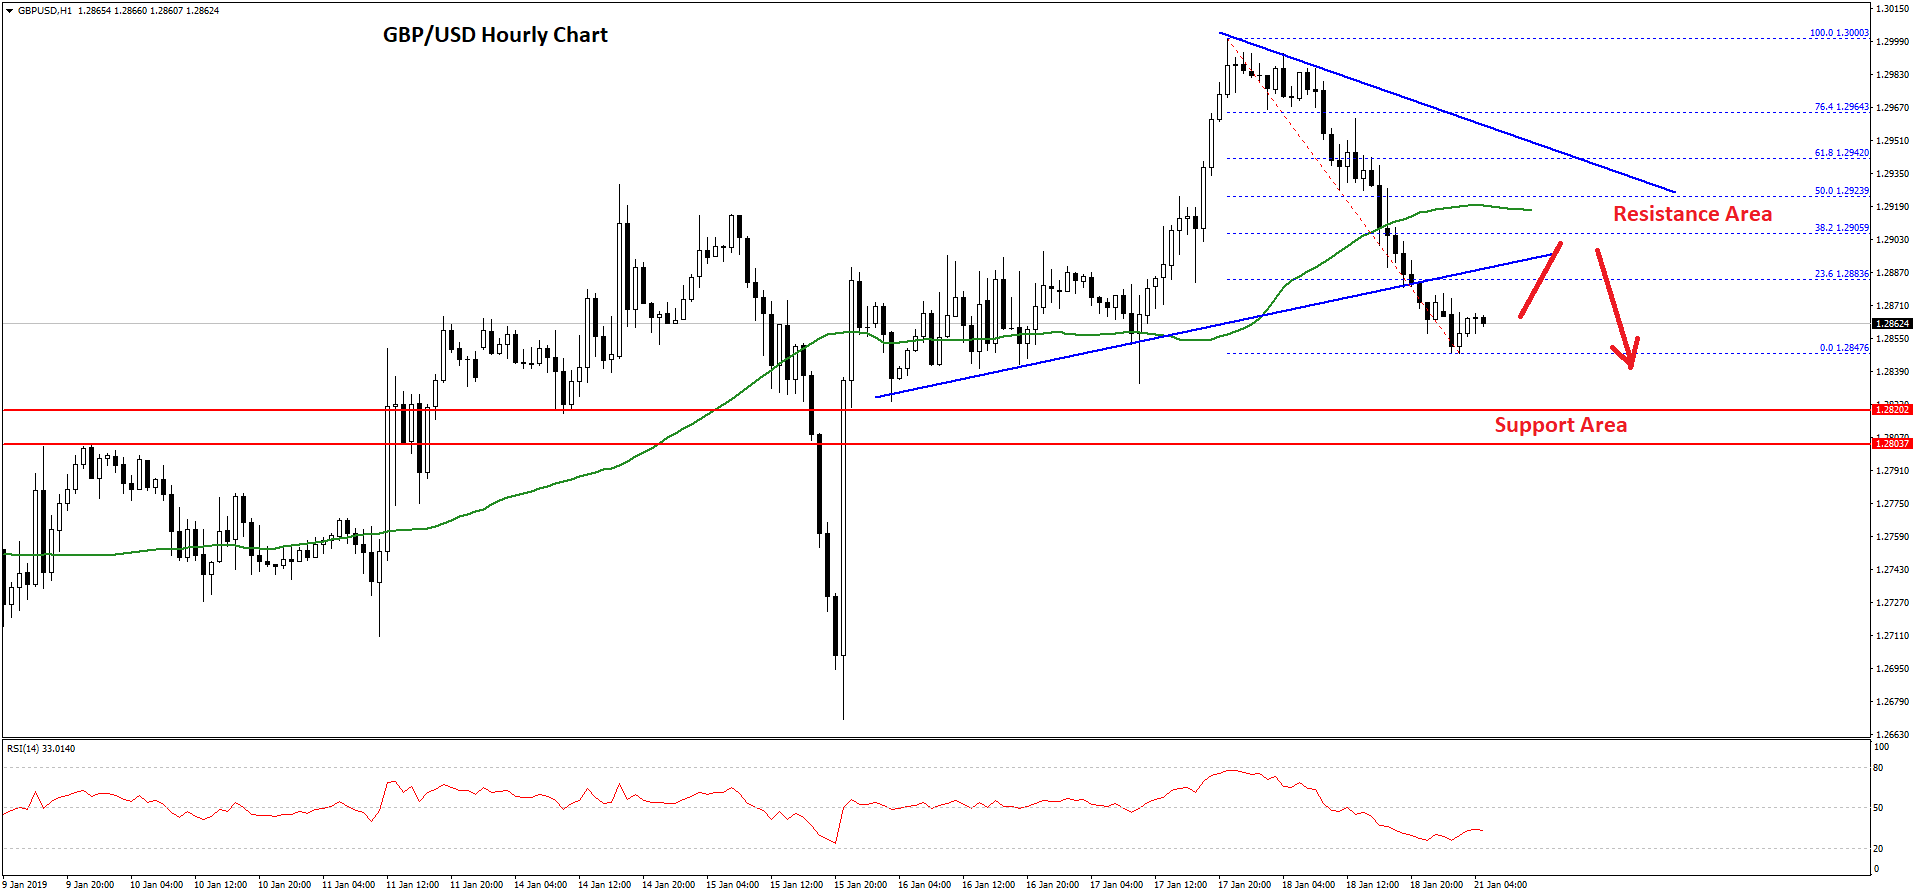
It declined below the 1.2950 support, the 50 hourly simple moving average, and a major bullish trend line with support at 1.2885 on the hourly chart of GBP/USD. Moreover, sellers pushed the pair below the 1.2900 support and a low was formed at 1.2847.
The pair is currently consolidating losses above the 1.2850 level, with an immediate resistance at 1.2880. The 23.6% Fib retracement level of the last decline from the 1.3000 high to 1.2847 low is also near the 1.2880 level.
However, the main resistance is near the 1.2920 and 1.2930 levels. The 50 hourly simple moving average is also positioned near the 1.2920 level plus the 50% Fib retracement level of the last decline from the 1.3000 high to 1.2847 low.
Therefore, if there is an upside correction, the pair is likely to test the 1.2900 and 1.2920 resistance levels. However, there is a risk of more losses towards the 1.2800 support level in the near term.
USD/CAD Technical Analysis
The US Dollar traded higher slow and steadily above the 1.3250 resistance area against the Canadian Dollar. The USD/CAD pair even broke the 1.3280 resistance area to move into a bullish zone.
Recently, the pair climbed above the 1.3300 level and the 50 hourly simple moving average. A high was formed at 1.3318 and later the pair started a downside correction. It declined below the 1.3250 support and the 50 hourly SMA.
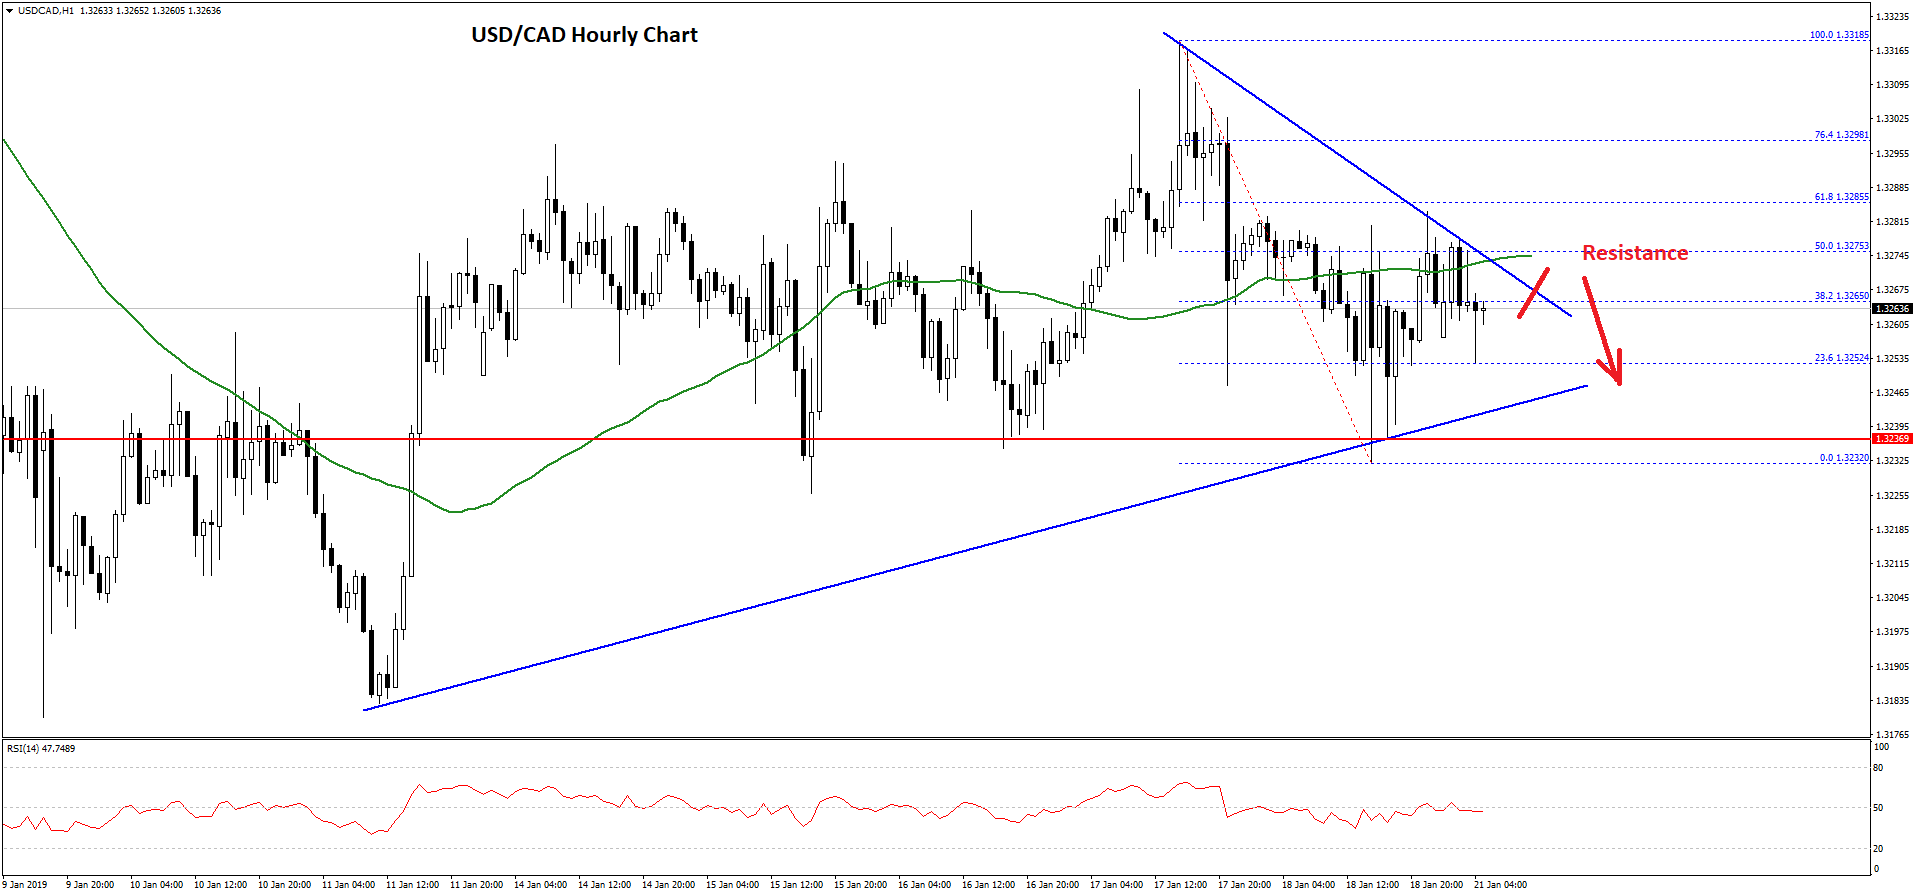
A low was formed at 1.3232 and the pair is currently trading above 1.3250. It seems like there is a breakout pattern formed with resistance at 1.3275 on the hourly chart.
The triangle resistance coincides with the 50% Fib retracement level of the recent decline from the 1.3318 high to 1.3232 low. If there is a positive break above the triangle and the 1.3280 resistance, there could be more gains.
The next stop could be 1.3300 and the 76.4% Fib retracement level of the recent decline from the 1.3318 high to 1.3232 low. Above 1.3300, the pair may continue to gain and it will most likely break the 1.3318 high to test the 1.3350 level.
On the downside, a break below the 1.3250 support may call for an extended downside correction to 1.3220 before a fresh upward move.
Trade over 50 forex markets 24 hours a day with FXOpen. Take advantage of low commissions, deep liquidity, and spreads from 0.0 pips (additional fees may apply). Open your FXOpen account now or learn more about trading forex with FXOpen.
This article represents the opinion of the Companies operating under the FXOpen brand only. It is not to be construed as an offer, solicitation, or recommendation with respect to products and services provided by the Companies operating under the FXOpen brand, nor is it to be considered financial advice.
Stay ahead of the market!
Subscribe now to our mailing list and receive the latest market news and insights delivered directly to your inbox.


Latest articles

EUR/USD Eyes Gains As USD/CHF Weakness Deepens Again
EUR/USD started a fresh increase above 1.1700 and 1.1720. USD/CHF declined further and is now struggling below 0.7835.
Important Takeaways for EUR/USD and USD/CHF Analysis Today
· The Euro started a decent increase from

Apple: Earnings Day Above the Activity Zone
On 30 April, after the market close, Apple Inc. will release its financial results for the second quarter of fiscal 2026. The consensus forecast, based on estimates from 31 analysts, points to revenue of around $109.7 billion, with expected

USD/JPY and USD/CHF Near Key Levels: The Dollar Supported by the Fed
The US dollar continues to trend upwards following the Federal Reserve meeting, drawing support from the regulator’s moderately hawkish stance and comments by Jerome Powell. Markets interpret the Fed’s rhetoric as a signal that restrictive policy is likely