


GBP/USD Could Recover and USD/CAD Remains in Uptrend
FXOpen
GBP/USD declined heavily and broke the 1.2800 support. On the other hand, USD/CAD remains in an uptrend above the 1.3100 support.
Important Takeaways for GBP/USD and USD/CAD
- The British Pound dropped significantly and broke the 1.2800 and 1.2760 supports.
- There is a major bearish trend line and resistance zone formed near 1.2810 on the hourly chart of GBP/USD.
- USD/CAD remains in a solid uptrend and is well supported above the 1.3100-20 zone.
- The pair may perhaps continue to move higher towards the 1.3180-90 levels.
GBP/USD Technical Analysis
The British Pound failed to recover above the 1.2900-1.2920 resistance zone against the US Dollar. The GBP/USD pair declined heavily and broke many support levels such as 1.2880, 1.2840, 1.2800 and 1.2750.
The pair traded close to the 1.2700 support and formed a new monthly low at 1.2722. The pair settled below the 1.2800 pivot level and the 50 hourly simple moving average.
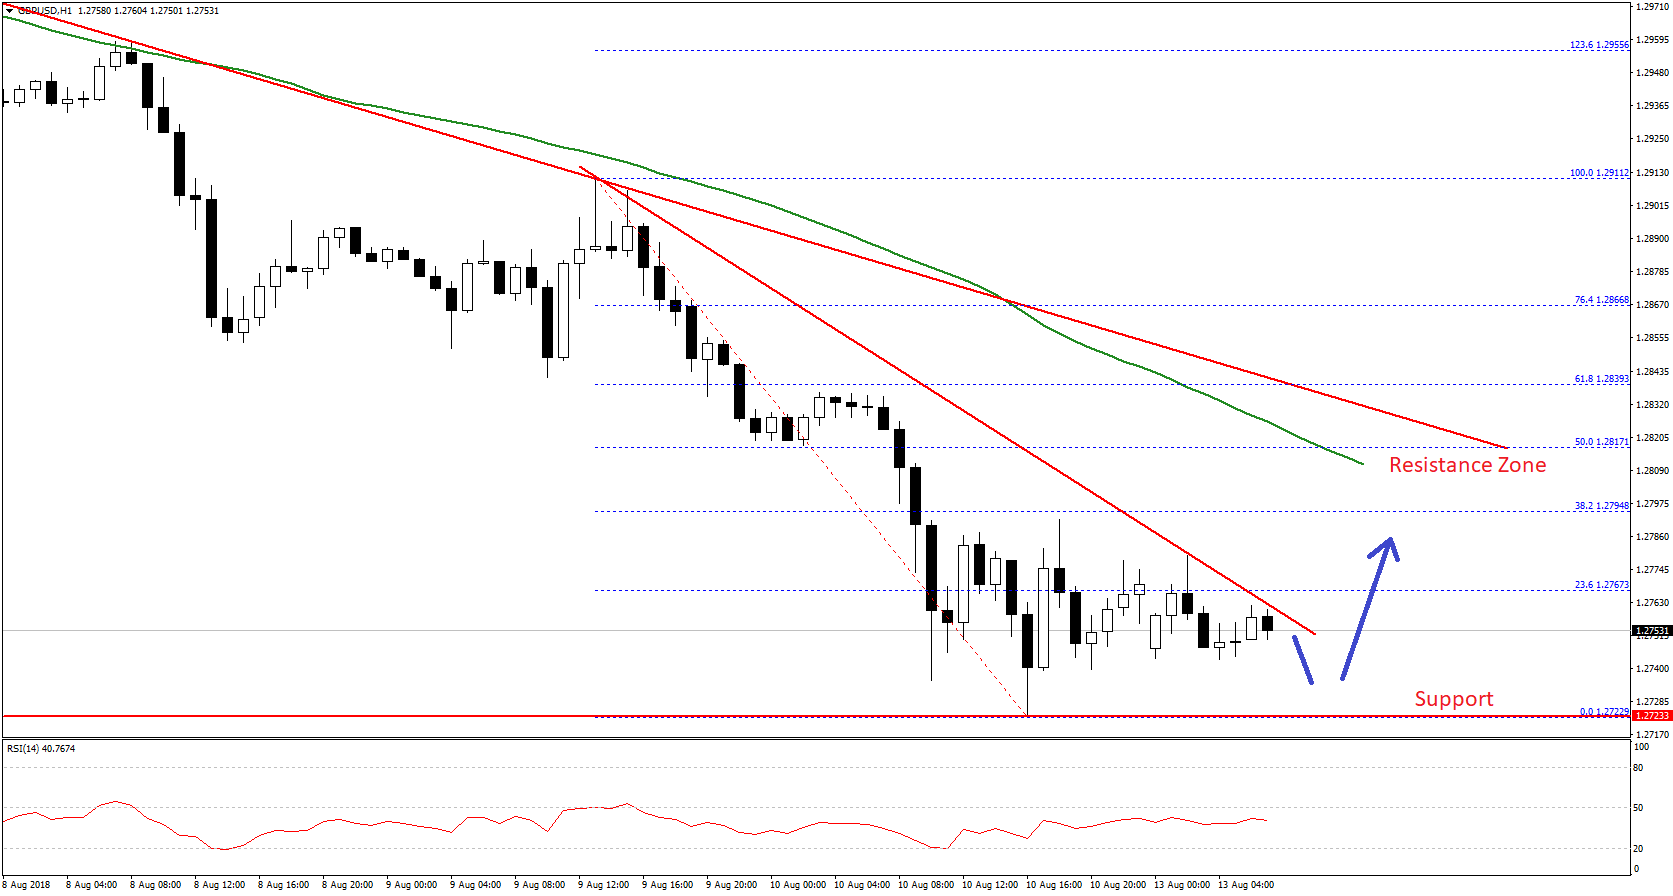
At present, the pair is consolidating losses and is trading above the 1.2750 level. It recently traded above the 23.6% Fib retracement level of the last decline from the 1.2911 high to 1.2722 low. However, the upside move was capped by the 1.2780-90 zone.
The pair is currently following a short term bearish trend line with resistance near 1.2765 on the hourly chart. A break above this could push the pair above the 1.2780 level in the near term.
The next major hurdle for buyers is sitting near the 1.2800-1.2810 resistance zone since there is a major bearish trend line and resistance zone formed near 1.2810 on the same chart. Moreover, the 50% Fib retracement level of the last decline from the 1.2911 high to 1.2722 low is positioned at 1.2817.
The last but not the least, the 50 hourly SMA is near the 1.2800 level to prevent gains in the near term. Therefore, if the pair break the 1.2765 and 1.2780 resistance levels, it could face a strong resistance near 1.2800.
On the downside, the 1.2750 and 1.2720 levels are decent supports. Below these, the pair may well break the 1.2700 support to extend losses towards the 1.2650 level.
USD/CAD Technical Analysis
The US Dollar started a solid upward move from the 1.3000 support zone against the Canadian Dollar. The USD/CAD pair surged higher and broke the 1.3060 and 1.3100 resistance levels to settle above the 50 hourly simple moving average.
The pair gained climbed above the 1.3120 pivot level and also broke the last swing high. More importantly, there was a break above the 1.236 Fib extension level of the last decline from the 1.3120 high to 1.3000 low.
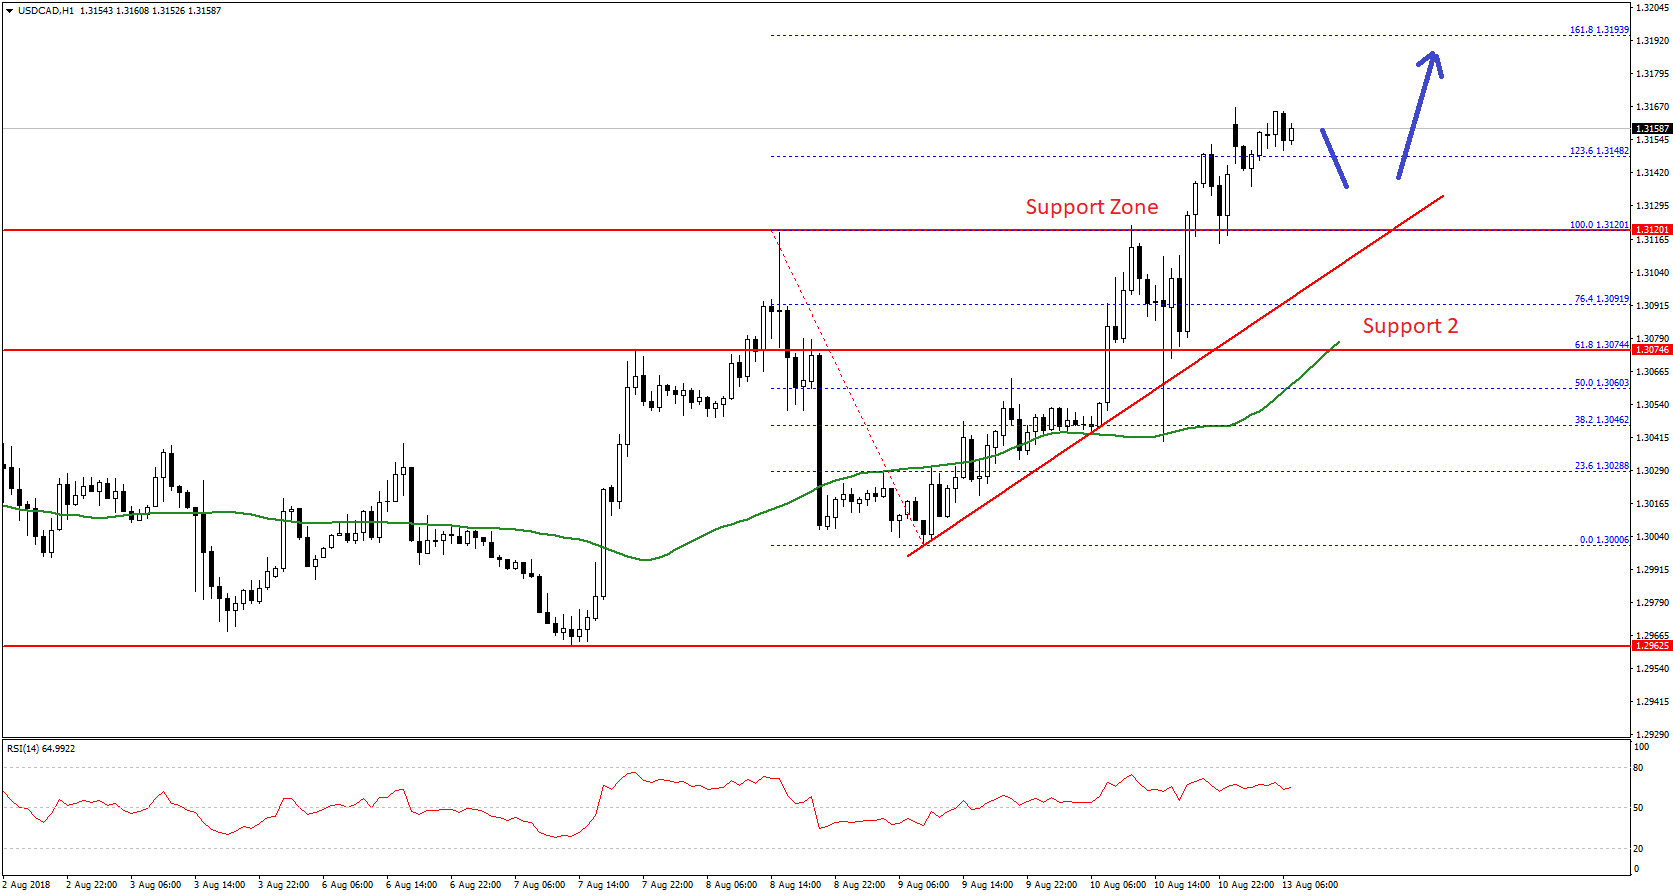
Therefore, it seems like the pair may possibly continue to move higher towards the 1.3180 resistance level. It could even test the 1.1618 Fib extension level of the last decline from the 1.3120 high to 1.3000 low at 1.3193.
If buyers remain in control, the pair could even make an attempt to break the 1.3200 resistance. On the downside, the pair remains well supported above the 1.3100 zone. The last resistance at 1.3120 is likely to provide support along with a key bullish trend line around the same levels on the hourly chart.
Therefore, dips from the current levels remain supported above 1.3100. On the upside, USD/CAD may well trade towards the 1.3180 and 1.3200 levels in the near term.
Trade over 50 forex markets 24 hours a day with FXOpen. Take advantage of low commissions, deep liquidity, and spreads from 0.0 pips (additional fees may apply). Open your FXOpen account now or learn more about trading forex with FXOpen.
This article represents the opinion of the Companies operating under the FXOpen brand only. It is not to be construed as an offer, solicitation, or recommendation with respect to products and services provided by the Companies operating under the FXOpen brand, nor is it to be considered financial advice.
Stay ahead of the market!
Subscribe now to our mailing list and receive the latest market news and insights delivered directly to your inbox.


Latest articles

FTSE 100: Correction Has Ended, but a New Impulse Has Yet to Form
Fundamental backdrop
The UK inflation report for April, published on 20 May, delivered unexpectedly positive figures: annual inflation slowed to 2.8% in April 2026 from 3.3% in March, coming in below the consensus forecast of 3.0% and

Candlestick Wick Analysis in Trading
Candlestick wicks often contain critical information about buying and selling pressure that body patterns alone may not

Market Structure Shift (MSS) in Trading
A Market Structure Shift (MSS) is an ICT trading concept used to identify potential changes