


GBP/USD Dives While GBP/JPY Aims More Upsides
FXOpen
GBP/USD started another decline from well above the 1.3120 level. GBP/JPY is rising and might gain pace above the 162.75 resistance zone
Important Takeaways for GBP/USD and GBP/JPY
· The British Pound started a fresh decline after it failed near 1.3150 against the US Dollar.
· There is a key bearish trend line forming with resistance near 1.3030 on the hourly chart of GBP/USD.
· GBP/JPY started a fresh increase after it cleared the 160.00 resistance zone.
· There is a major bullish trend line forming with support near 161.75 on the hourly chart.
GBP/USD Technical Analysis
This past week, the British Pound attempted a recovery wave above the 1.3120 level against the US Dollar. However, the GBP/USD pair failed to gain strength for a move above the 1.3150 resistance.
As a result, the pair reacted to the downside and traded below the 1.3100 level. There was a clear move below the 1.3050 support and the 50 hourly simple moving average. It even spiked below 1.3000 and traded as low as 1.2982 on FXOpen.
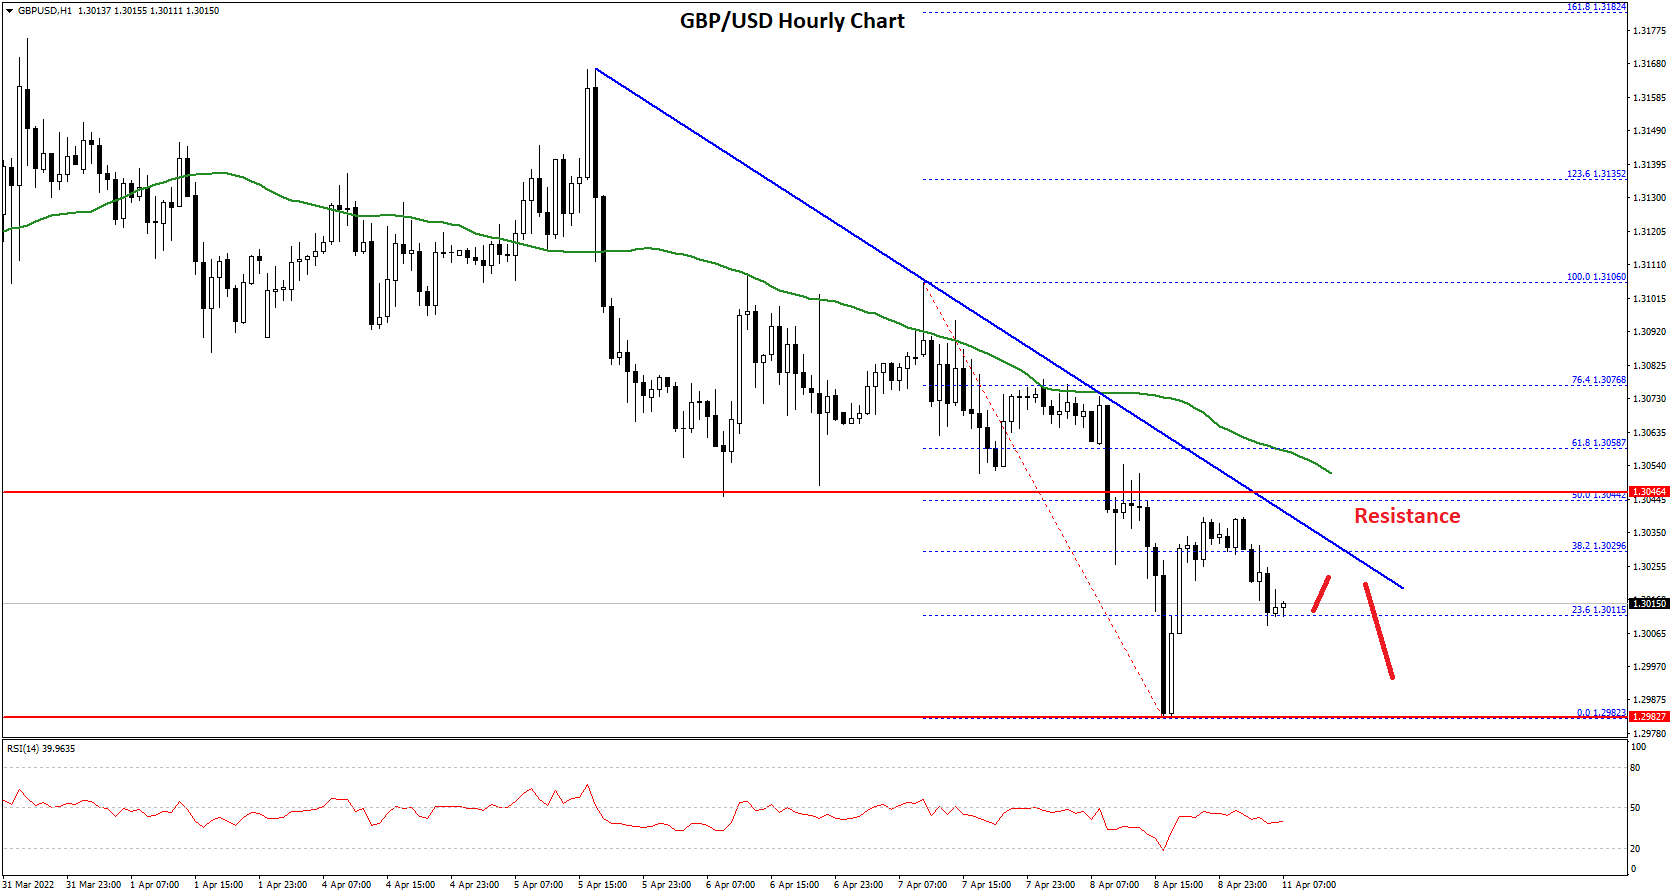
It is currently attempting an upside correction above 1.3000. There was a move above the 23.6% Fib retracement level of the recent decline from the 1.3106 swing high to 1.2982 low.
However, the pair is facing a major resistance near the 1.3040 and 1.3050 levels. There is also a key bearish trend line forming with resistance near 1.3030 on the hourly chart of GBP/USD. The 50% Fib retracement level of the recent decline from the 1.3106 swing high to 1.2982 low is also above the trend line.
The next major hurdle is near 1.3080, above which the pair could rise towards 1.3150 in the near term. If not, the pair might continue to decline below 1.3000.
The next major support is near the 1.2950 level. If there is a break below the 1.2950 support, the pair could test the 1.2880 support.
GBP/JPY Technical Analysis
The British Pound also started a fresh increase from well below the 160.00 level against the Japanese Yen. The GBP/JPY pair gained pace above the 160.50 level to enter a positive zone.
There was a clear move above the 161.50 level and the 50 hourly simple moving average. The pair traded as high as 162.67 and is currently consolidating gains.
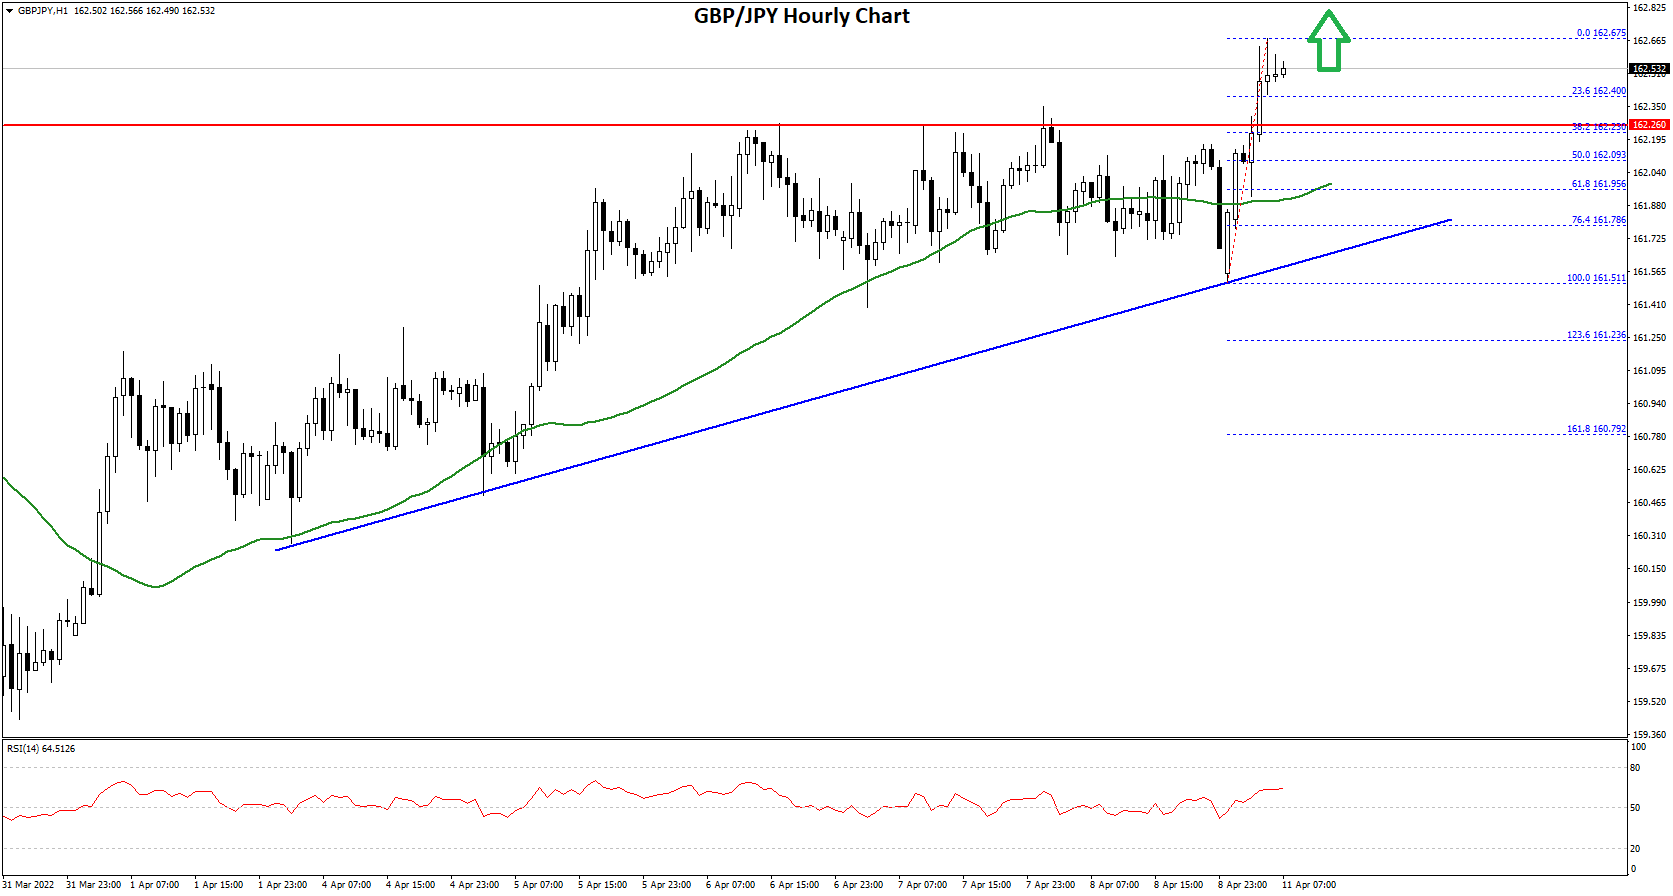
An initial support on the downside is near the 162.40 level. It is near the 23.6% Fib retracement level of the upward move from the 161.51 swing low to 162.67 high. The next major support is near the 162.00 level.
There is also a major bullish trend line forming with support near 161.75 on the hourly chart. An intermediate support might be the 50% Fib retracement level of the upward move from the 161.51 swing low to 162.67 high at 162.10 or the 50 hourly simple moving average.
If there is a downside break below the 162.00 support, the pair could decline towards the 161.50 support zone. Any more losses might send the pair towards the 161.20 level in the near term.
On the upside, GBP/JPY is facing resistance near the 162.75 level. The next key resistance could be 168.00. A clear break above the 168.00 resistance could push the pair towards the 168.40 resistance.
This forecast represents FXOpen Markets Limited opinion only, it should not be construed as an offer, invitation or recommendation in respect to FXOpen Markets Limited products and services or as financial advice.
This article represents the opinion of the Companies operating under the FXOpen brand only. It is not to be construed as an offer, solicitation, or recommendation with respect to products and services provided by the Companies operating under the FXOpen brand, nor is it to be considered financial advice.
Stay ahead of the market!
Subscribe now to our mailing list and receive the latest market news and insights delivered directly to your inbox.

Latest articles

US Dollar Strengthens Amid Equity Market Weakness and Hawkish Fed Rhetoric
The US dollar continues to hold firm near multi-year highs as sentiment across equity markets deteriorates and investors increasingly expect the Federal Reserve to maintain a restrictive monetary policy stance for longer. The US economy remains resilient, while inflation risks

Bitcoin: Corrective Channel Broken as Traders Turn More Active
Bitcoin has come under the influence of several factors simultaneously. The wave of selling at the beginning of June was linked to Strategy's first disclosed Bitcoin sale in several years, a prolonged series of outflows from spot ETFs, and a

DAX 40: consolidation amid technology sell-off
A wave of selling in the technology sector that emerged earlier this week has weighed on European equities. The trigger was investor concern over the profitability of large-scale debt-funded investments by major US tech companies in AI infrastructure. The Nasdaq