


GBP/USD Eyes Steady Recovery, EUR/GBP Faces Hurdle
FXOpen
GBP/USD started a recovery wave from a new low at 1.0341 and climbed above 1.1000. EUR/GBP is now facing a major resistance near 0.8870.
Important Takeaways for GBP/USD and EUR/GBP
· The British Pound started a fresh recovery wave above the 1.0920 resistance zone against the US Dollar.
· There was a break above a couple of bearish trend lines at 1.0700 and 1.0800 on the hourly chart of GBP/USD.
· EUR/GBP started a sharp decline and traded below the 0.8900 level.
· There is a major bearish trend line forming with resistance near 0.8830 on the hourly chart.
GBP/USD Technical Analysis
The British Pound found support near the 1.0340 zone against the US Dollar. The GBP/USD pair started a recovery wave and was able to clear the 1.0650 resistance zone.
There was a decent increase above the 1.0920 level and the 50 hourly simple moving average. The pair even climbed above the 1.1100 level. During the increase, there was a break above a couple of bearish trend lines at 1.0700 and 1.0800 on the hourly chart of GBP/USD.
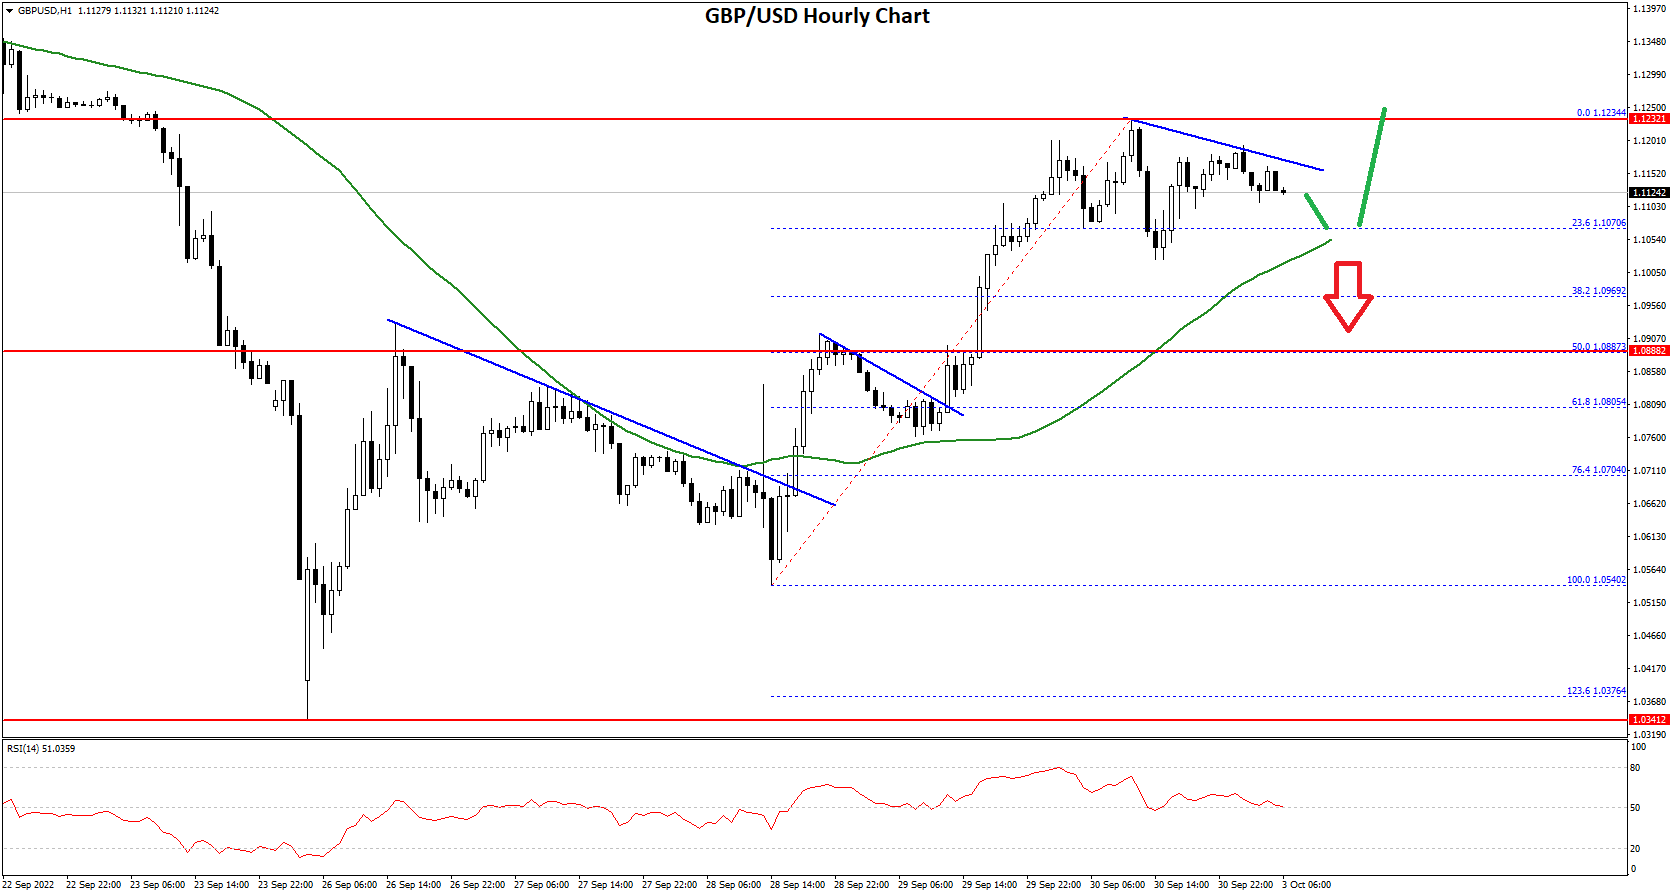
A high was formed near 1.1234 on FXOpen and the pair is now correcting gains. On the downside, an initial support is near the 1.1070 level. It is near the 23.6% Fib retracement level of the upward move from the 1.0540 swing low to 1.1234 high.
The next major support is near the 1.0880 level. It is near the 50% Fib retracement level of the upward move from the 1.0540 swing low to 1.1234 high. Any more losses could lead the pair towards the 1.0750 support zone or even 1.0680.
On the upside, an initial resistance is near the 1.1230 level. The next main resistance is near the 1.1300 zone. A clear upside break above the 1.1300 and 1.1310 resistance levels could open the doors for a steady increase in the near term. The next major resistance sits near the 1.1500 level.
EUR/GBP Technical Analysis
The Euro started a major decline from well above the 0.9200 level against the British Pound. The EUR/GBP pair declined below the 0.9000 support zone to move into a bearish zone.
The pair even traded below the 0.8900 level and the 50 hourly simple moving average. It traded as low as 0.8752 and is currently consolidating losses. On the upside, an immediate resistance is near the 0.8825 level.
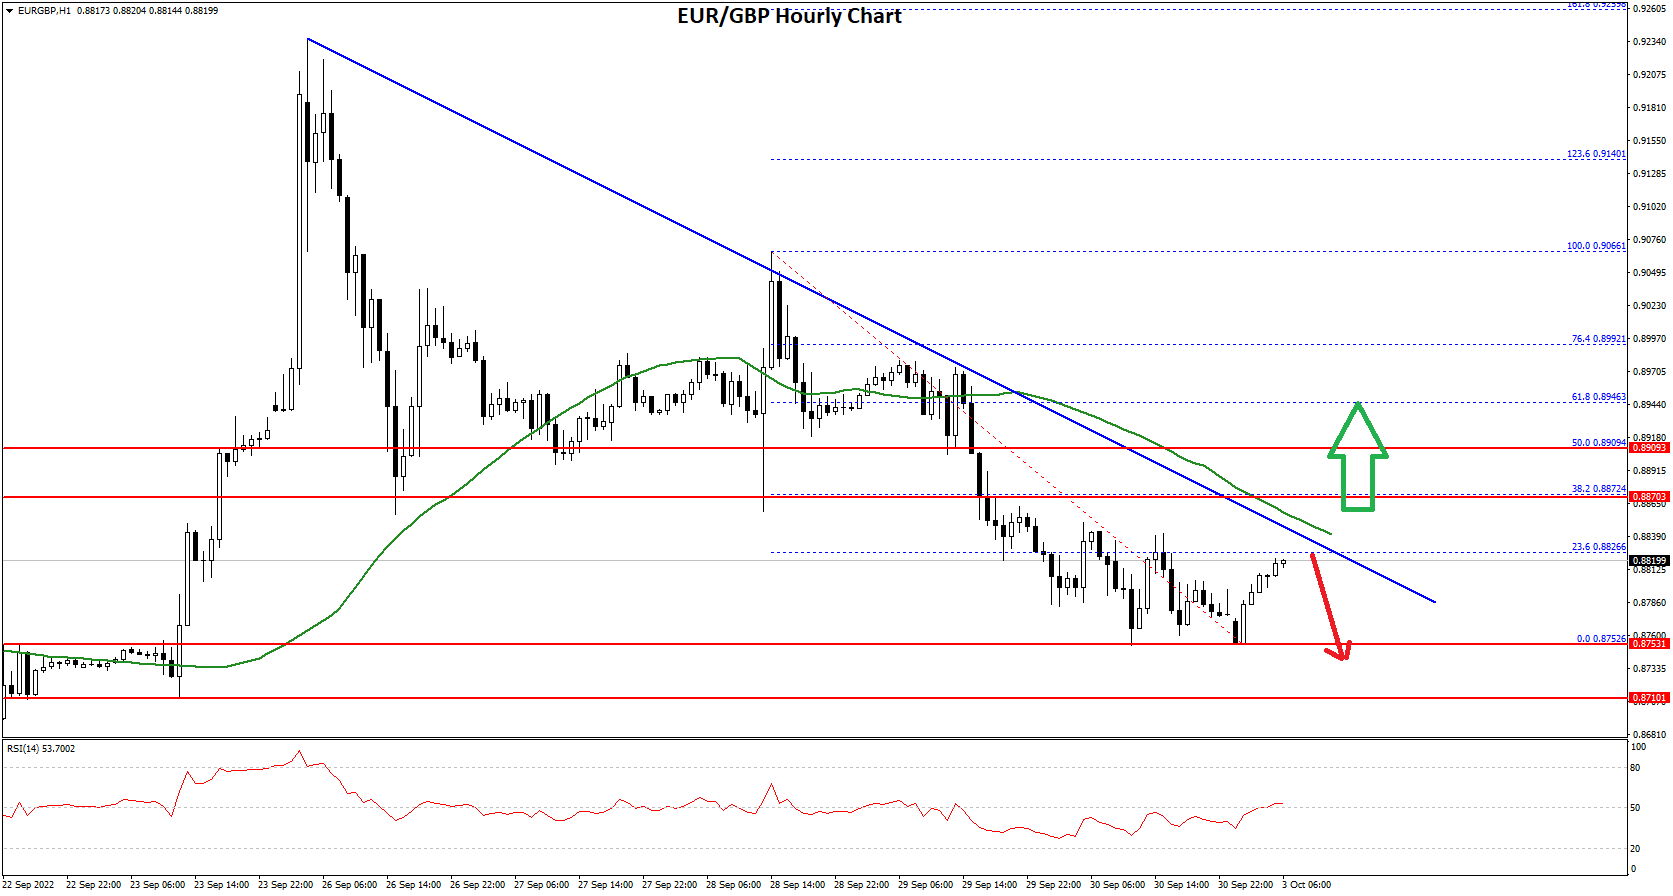
Besides, there is a major bearish trend line forming with resistance near 0.8830 on the hourly chart. The trend line is near the 23.6% Fib retracement level of the downward move from the 0.9066 swing high to 0.8752 low.
The next major resistance for the bulls is near the 0.8900 level. It is close to the 50% Fib retracement level of the downward move from the 0.9066 swing high to 0.8752 low. A clear move above the 0.8900 resistance might push the price higher towards the 0.9000 level.
On the downside, an initial support is near the 0.8765 level. The next major support is near 0.8750. A downside break below the 0.8750 support might call for more downsides. In the stated case, the pair could decline towards the 0.8700 support level in the near term.
This forecast represents FXOpen Companies opinion only, it should not be construed as an offer, invitation or recommendation in respect to FXOpen Companies products and services or as financial advice.
Trade over 50 forex markets 24 hours a day with FXOpen. Take advantage of low commissions, deep liquidity, and spreads from 0.0 pips (additional fees may apply). Open your FXOpen account now or learn more about trading forex with FXOpen.
This article represents the opinion of the Companies operating under the FXOpen brand only. It is not to be construed as an offer, solicitation, or recommendation with respect to products and services provided by the Companies operating under the FXOpen brand, nor is it to be considered financial advice.
Stay ahead of the market!
Subscribe now to our mailing list and receive the latest market news and insights delivered directly to your inbox.


Latest articles

AUD/CAD: Months of Indecision — Is a Breakout Finally Coming?
The Australian dollar has clawed back most of its end-of-June losses, when it touched three-month lows against the greenback amid escalating Middle East tensions. Since then, sentiment has improved: the RBA's Assistant Governor Sarah Hunter signalled the board stands ready

USD/JPY: Battling at the Top of the Triangle
On 3 July, Japan's Finance Minister, Satsuki Katayama, stated that the Ministry of Finance remains in close contact with US authorities regarding developments in USD/JPY as the yen traded near its weakest level in almost 40 years. Similar verbal

Dow Jones (DJIA): Consolidation Beyond the Trend
Federal Reserve Chair Kevin Warsh testified before Congress on 14–15 July, reaffirming the Fed's commitment to bringing inflation back to target while providing no clear guidance on the future path of interest rates. Meanwhile, June inflation data came in