


GBP/USD Eyes Upside Break While GBP/JPY Is Rising
FXOpen

GBP/USD is rising and it could continue higher if there is a break above 1.3700. GBP/JPY is surging and it is trading above the 152.50 pivot level.
Important Takeaways for GBP/USD and GBP/JPY
· The British Pound traded as low as 1.3414 before it started an upside correction against the US Dollar.
· There was a break above a major bearish trend line with resistance near 1.3610 on the hourly chart of GBP/USD.
· GBP/JPY gained pace and was able to clear the 152.50 resistance zone.
· There is a key bullish trend line forming with support near 152.20 on the hourly chart.
GBP/USD Technical Analysis
This past week, the British Pound extended its decline below the 1.3550 support level against the US Dollar. The GBP/USD pair even broke the 1.3500 and 1.3450 support levels.
It traded as low as 1.3414 on FXOpen before it started a decent increase. There was a steady increase above the 1.3500 resistance level. The price surpassed the 1.3550 resistance level, but it remained below the 50 hourly simple moving average.
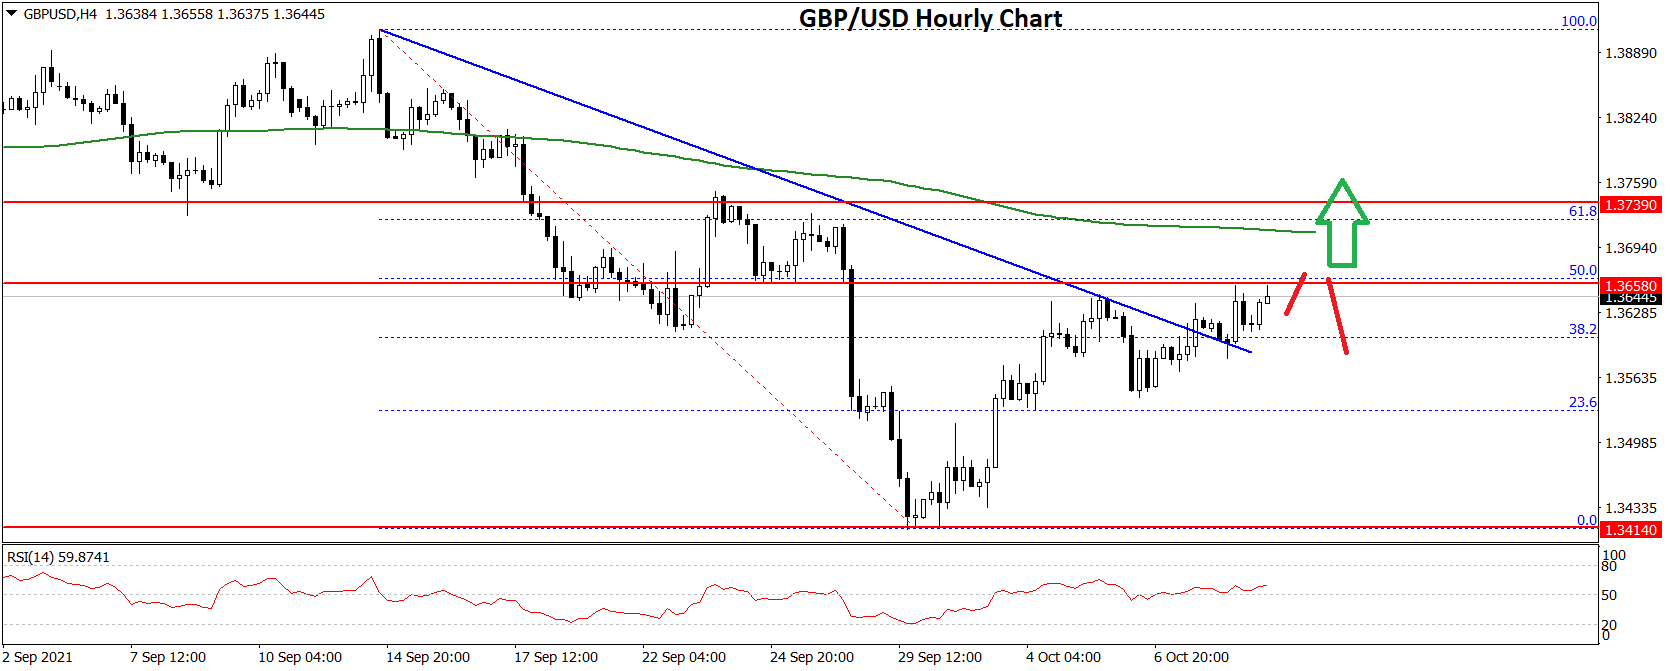
There was a break above a major bearish trend line with resistance near 1.3610 on the hourly chart of GBP/USD. Besides, the pair surpassed the 38.2% Fib retracement level of the main decline from the 1.3912 swing high to 1.3414 low.
The pair even climbed above 1.3600 and retested the 1.3620 resistance levels. However, the pair is now facing resistance near the 1.3660 level. It is also struggling near the 50% Fib retracement level of the main decline from the 1.3912 swing high to 1.3414 low.
A close above the 1.3660 level could open the doors for more gains. The next major hurdle is near 1.3700 and the 50 hourly SMA, above which the pair could surge towards 1.3800.
On the downside, an immediate support is near the 1.3620 level. The next major support is near the 1.3550 level. If there is a break below the 1.3550 support, the pair could test the 1.3500 support. If there are additional losses, the pair could decline towards the 1.3420 level.
GBP/JPY Technical Analysis
The British Pound formed a base above the 150.00 zone against the Japanese Yen. The GBP/JPY pair broke the 151.20 resistance zone to move into a positive zone.
The pair traded above the 151.80 and 152.00 resistance levels. It is now trading above 153.00 and the recent high was 153.52. On the downside, an initial support is near the 153.00 level.
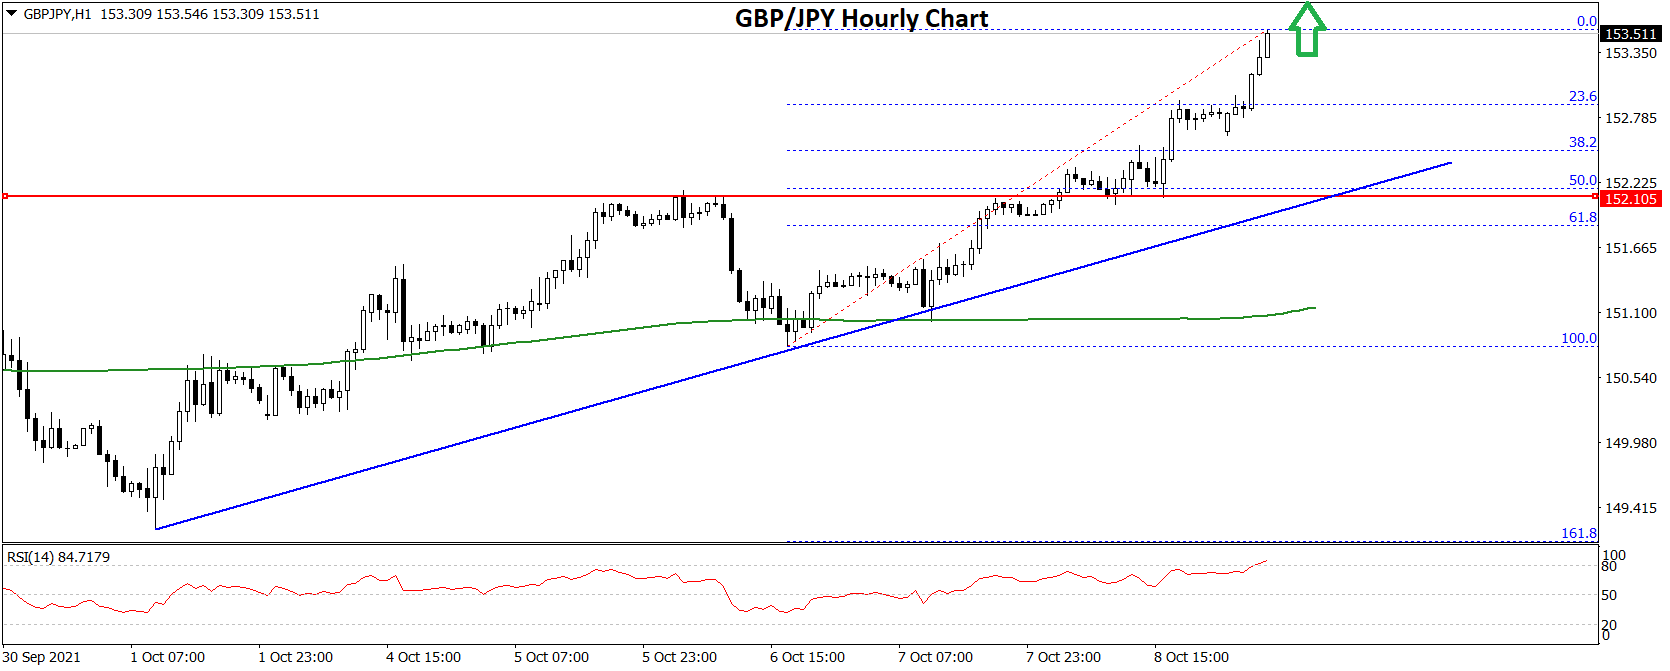
The 23.6% Fib retracement level of the recent increase from the 150.80 swing low to 153.52 high is also near the 153.00 zone. The next major support is near the 152.80 level. There is also a key bullish trend line forming with support near 152.20 on the hourly chart.
The next major support is near the 152.20 level. It is near the 50% Fib retracement level of the recent increase from the 150.80 swing low to 153.52 high.
Any more downsides may possibly spark a major decline towards 151.20. On the upside, the pair is now facing resistance near the 153.65 level. The next key resistance could be 153.80. A clear break above the 153.80 resistance could push the pair towards the 155.00 resistance.
This forecast represents FXOpen Markets Limited opinion only, it should not be construed as an offer, invitation or recommendation in respect to FXOpen Markets Limited products and services or as financial advice.
This article represents the opinion of the Companies operating under the FXOpen brand only. It is not to be construed as an offer, solicitation, or recommendation with respect to products and services provided by the Companies operating under the FXOpen brand, nor is it to be considered financial advice.
Stay ahead of the market!
Subscribe now to our mailing list and receive the latest market news and insights delivered directly to your inbox.

Latest articles

AUD/USD: Will the RBA Be Able to Keep Its Currency Strong?
As the chart shows, AUD/USD has entered a distinctly bearish phase in recent weeks, reflecting the broader consolidation — and in some cases outright weakness — that the US dollar has begun imposing across most major currency pairs.
Fundamental Analysis
The

AUD/CAD: Pair Remains Range-Bound Amid Interest Rate Divergence
The key macroeconomic factor for AUD/CAD remains the divergence in monetary policy between the two central banks. After three consecutive rate hikes since the beginning of the year, the Reserve Bank of Australia left its cash rate unchanged at

Brent Crude Oil Analysis: Stabilisation or Simply a Pause?
Over the past few weeks, financial markets have been more focused than ever on developments surrounding the Strait of Hormuz — a critical waterway at the centre of ongoing US-Iran negotiations. The back-and-forth of diplomatic headlines has injected significant volatility into