


GBP/USD Faces Resistance While EUR/GBP Eyes More Gains
FXOpen
GBP/USD started a fresh increase above the 1.2150 resistance. EUR/GBP is showing positive signs above the 0.8550 resistance zone.
Important Takeaways for GBP/USD and EUR/GBP
· The British Pound started a decent increase above 1.2150 against the US Dollar.
· There was a break below a key bullish trend line with support near 1.2220 on the hourly chart of GBP/USD.
· EUR/GBP is holding the 0.8580 support but struggling above 0.8600.
· There is a major bullish trend line forming with support near 0.8570 on the hourly chart.
GBP/USD Technical Analysis
The British Pound remained well bid above the 1.1920 zone against the US Dollar. The GBP/USD pair started a decent increase after it broke the 1.2000 resistance.
There was a clear move above the 1.2100 level and the 50 hourly simple moving average. The bulls were even able to clear the 1.2150 resistance. However, the pair struggled near the 1.2400 resistance and started a downside correction.
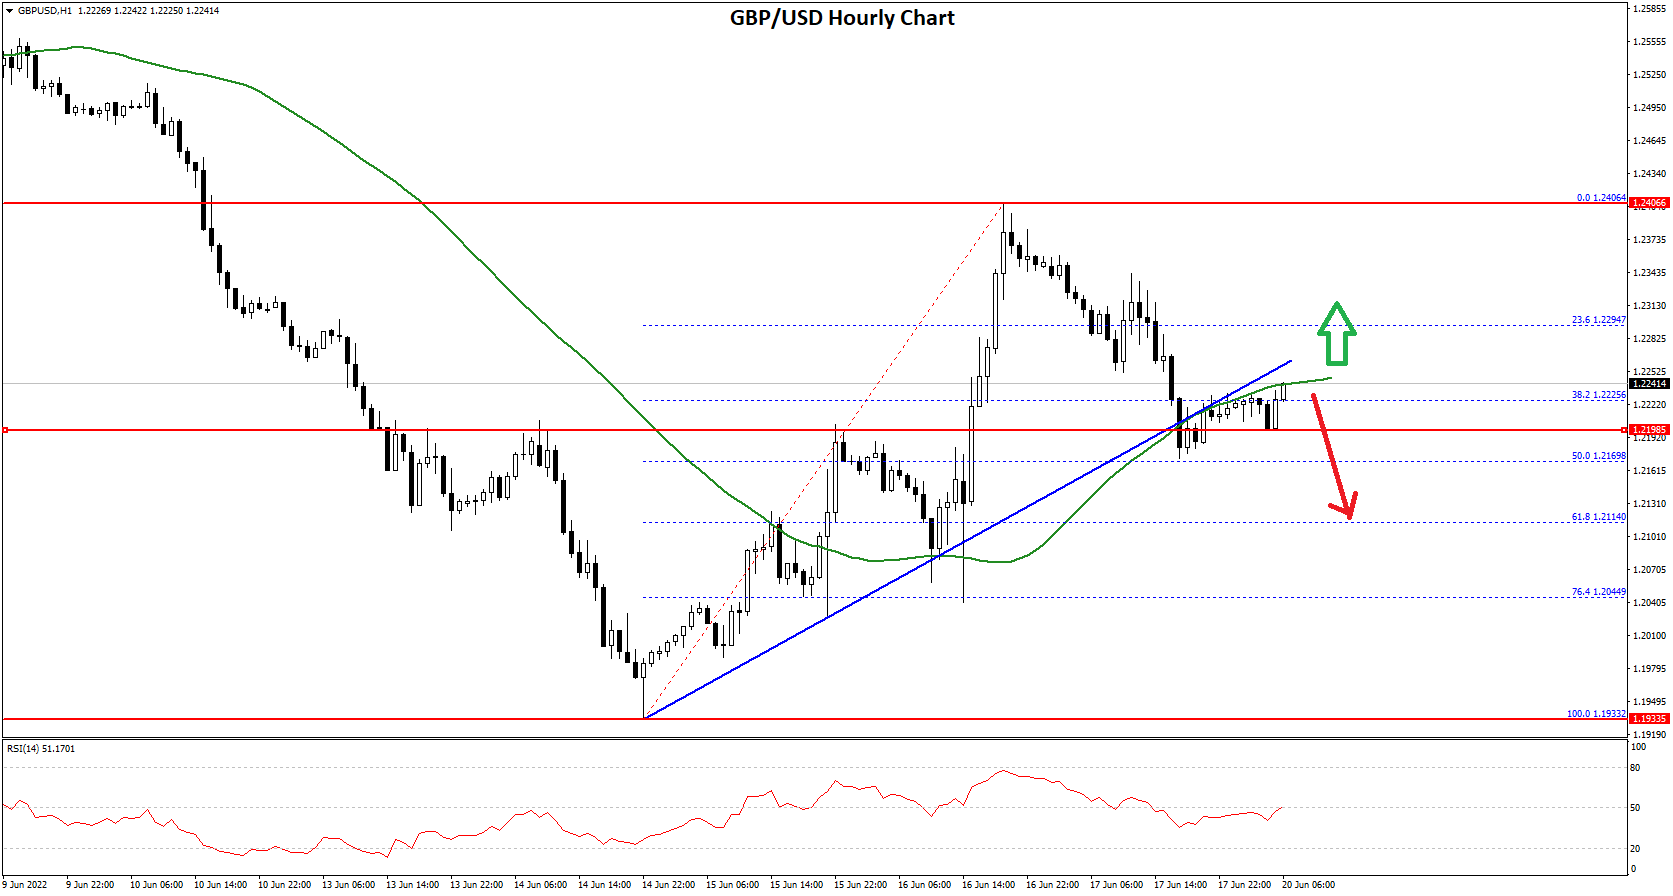
There was a break below a key bullish trend line with support near 1.2220 on the hourly chart of GBP/USD. The pair traded below the 38.2% Fib retracement level of the upward move from the 1.1933 swing low to 1.2406 high (formed on FXOpen).
The pair tested the 50% Fib retracement level of the upward move from the 1.1933 swing low to 1.2406 high. It is now rising and trading above the 1.2240 level.
On the upside, an initial resistance is near the 1.2280 level. The next main resistance is near the 1.2320 zone. A clear upside break above the 1.2320 and 1.2330 resistance levels could open the doors for a steady increase in the near term. The next major resistance sits near the 1.2400 level.
If not, the pair might start a fresh decline below 1.2180. The next major support is near the 1.2150 level. Any more losses could lead the pair towards the 1.2050 support zone or even 1.2020.
EUR/GBP Technical Analysis
The Euro struggled to continue higher above the 0.8720 level against the British Pound. The EUR/GBP pair started a fresh decline and traded below the 0.8620 support.
The pair even traded below the 0.8550 level and the 50 hourly simple moving average. It traded as low as 0.8510 and is currently attempting an upside break. There was a move above the 38.2% Fib retracement level of the key decline from the 0.8720 high to 0.8510 low.
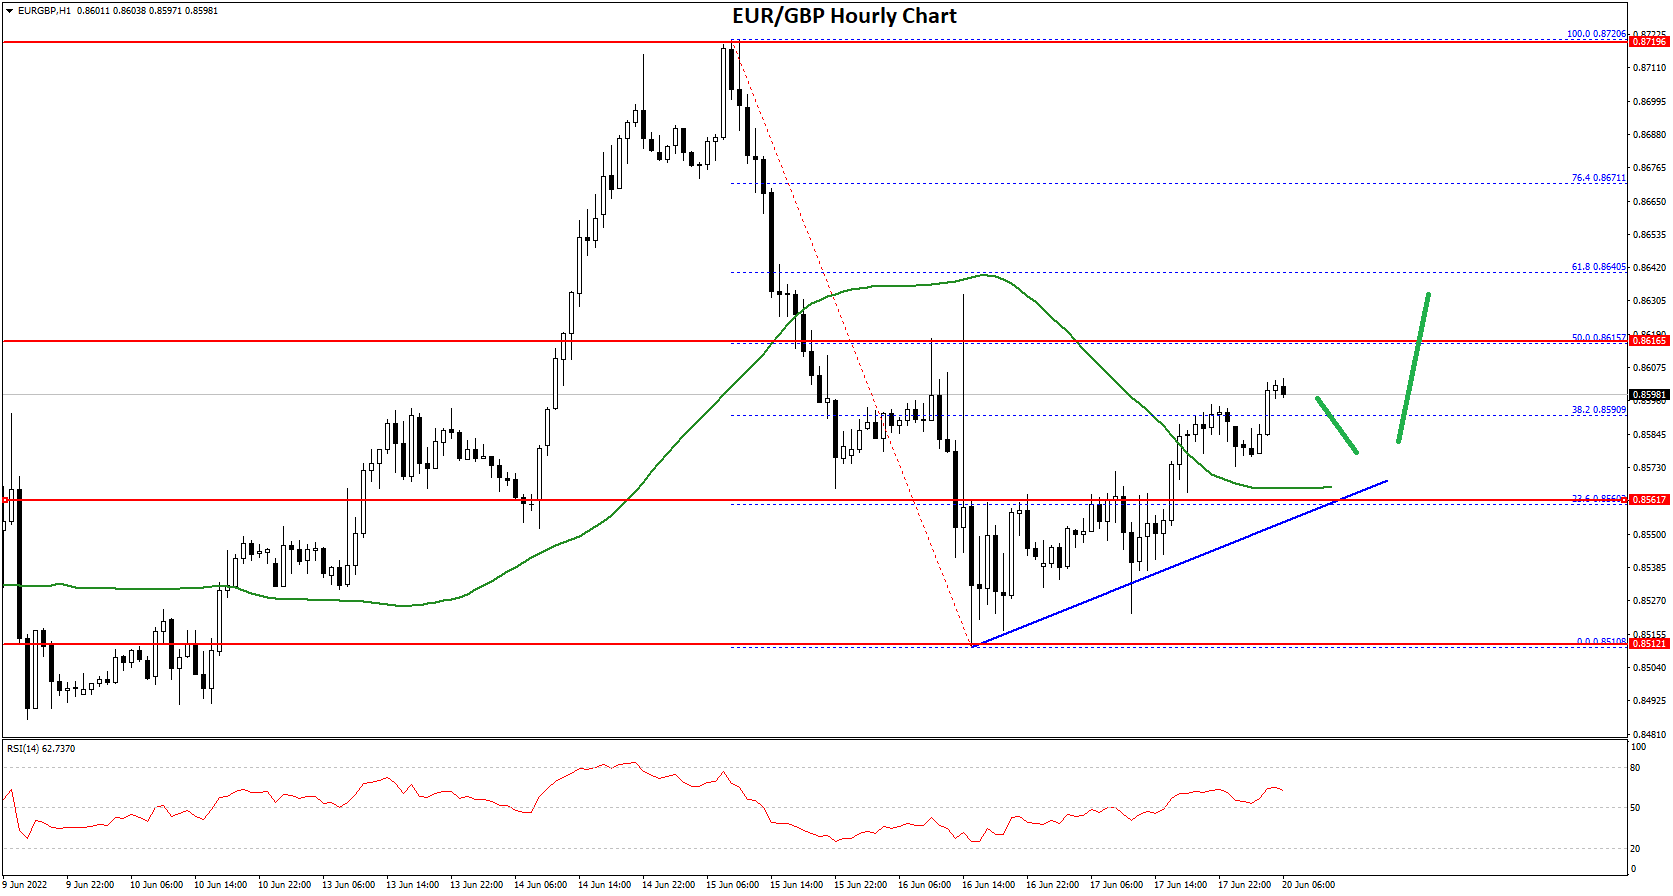
Besides, there is a major bullish trend line forming with support near 0.8570 on the hourly chart. The pair is now facing resistance near the 0.8600 level, but it is above the 50 hourly simple moving average.
The next major resistance for the bulls is near the 0.8615 level. It is near the 50% Fib retracement level of the key decline from the 0.8720 high to 0.8510 low. A clear move above the 0.8615 resistance might push the price higher.
The next main resistance on the upside is near the 0.8650 level, above which the pair could even climb towards 0.8700. On the downside, an initial support is near the 0.8570 level. The next major support is near 0.8550
A downside break below the 0.8550 support might call for more downsides. In the stated case, the pair could decline towards the 0.8500 support level in the near term.
This forecast represents FXOpen Markets Limited opinion only, it should not be construed as an offer, invitation or recommendation in respect to FXOpen Markets Limited products and services or as financial advice.
Trade over 50 forex markets 24 hours a day with FXOpen. Take advantage of low commissions, deep liquidity, and spreads from 0.0 pips (additional fees may apply). Open your FXOpen account now or learn more about trading forex with FXOpen.
This article represents the opinion of the Companies operating under the FXOpen brand only. It is not to be construed as an offer, solicitation, or recommendation with respect to products and services provided by the Companies operating under the FXOpen brand, nor is it to be considered financial advice.
Stay ahead of the market!
Subscribe now to our mailing list and receive the latest market news and insights delivered directly to your inbox.


Latest articles

US Dollar Index: A Defining Week for the King of the Markets
The dollar heads into a pivotal week trading near 101.80, just off a 15-month high, with the Fed's July 29 meeting standing as the clear focal point. Markets currently price roughly a 65% chance of a hold, though renewed

NZD/USD: Inflation Surge Meets Strong US Dollar Pressure
On 21 July, Stats NZ reported an acceleration in inflation: the Consumer Price Index rose 1.5% in the second quarter, while the annual inflation rate climbed to 4.1%, its highest level in more than two years and slightly

Weekly Market Insights with Gary Thomson: The Week of Central Banks and Earnings
In this video, we’ll explore the key economic events and market trends, shaping the financial landscape. Get ready for insights into financial markets to help you navigate the week ahead. Let’s dive in!
In this episode of Market