


GBP/USD Facing Key Resistance, USD/CAD Remains Supported
FXOpen

GBP/USD gained momentum above the 1.3700 resistance, but it struggled near 1.3745. USD/CAD is holding the 1.2750 support, but it is struggling below 1.2820.
Important Takeaways for GBP/USD and USD/CAD
- The British Pound is holding gains above the 1.3650 and 1.3680 levels.
- There is a connecting bullish trend line forming with support near 1.3690 on the hourly chart of GBP/USD.
- USD/CAD struggled to stay above 1.2820 and corrected lower.
- There is a major bullish trend line forming with support near 1.2770 on the hourly chart.
GBP/USD Technical Analysis
After forming a base above the 1.3620 level, the British Pound started a fresh increase against the US Dollar. The GBP/USD pair broke the 1.3700 resistance level to move into a positive zone.
There was also a break above 1.3720 and the 50 hourly simple moving average. However, the pair seems to be facing a strong resistance near the 1.3745 and 1.3750 levels. The recent high was formed near 1.3751 on FXOpen before the pair corrected lower.
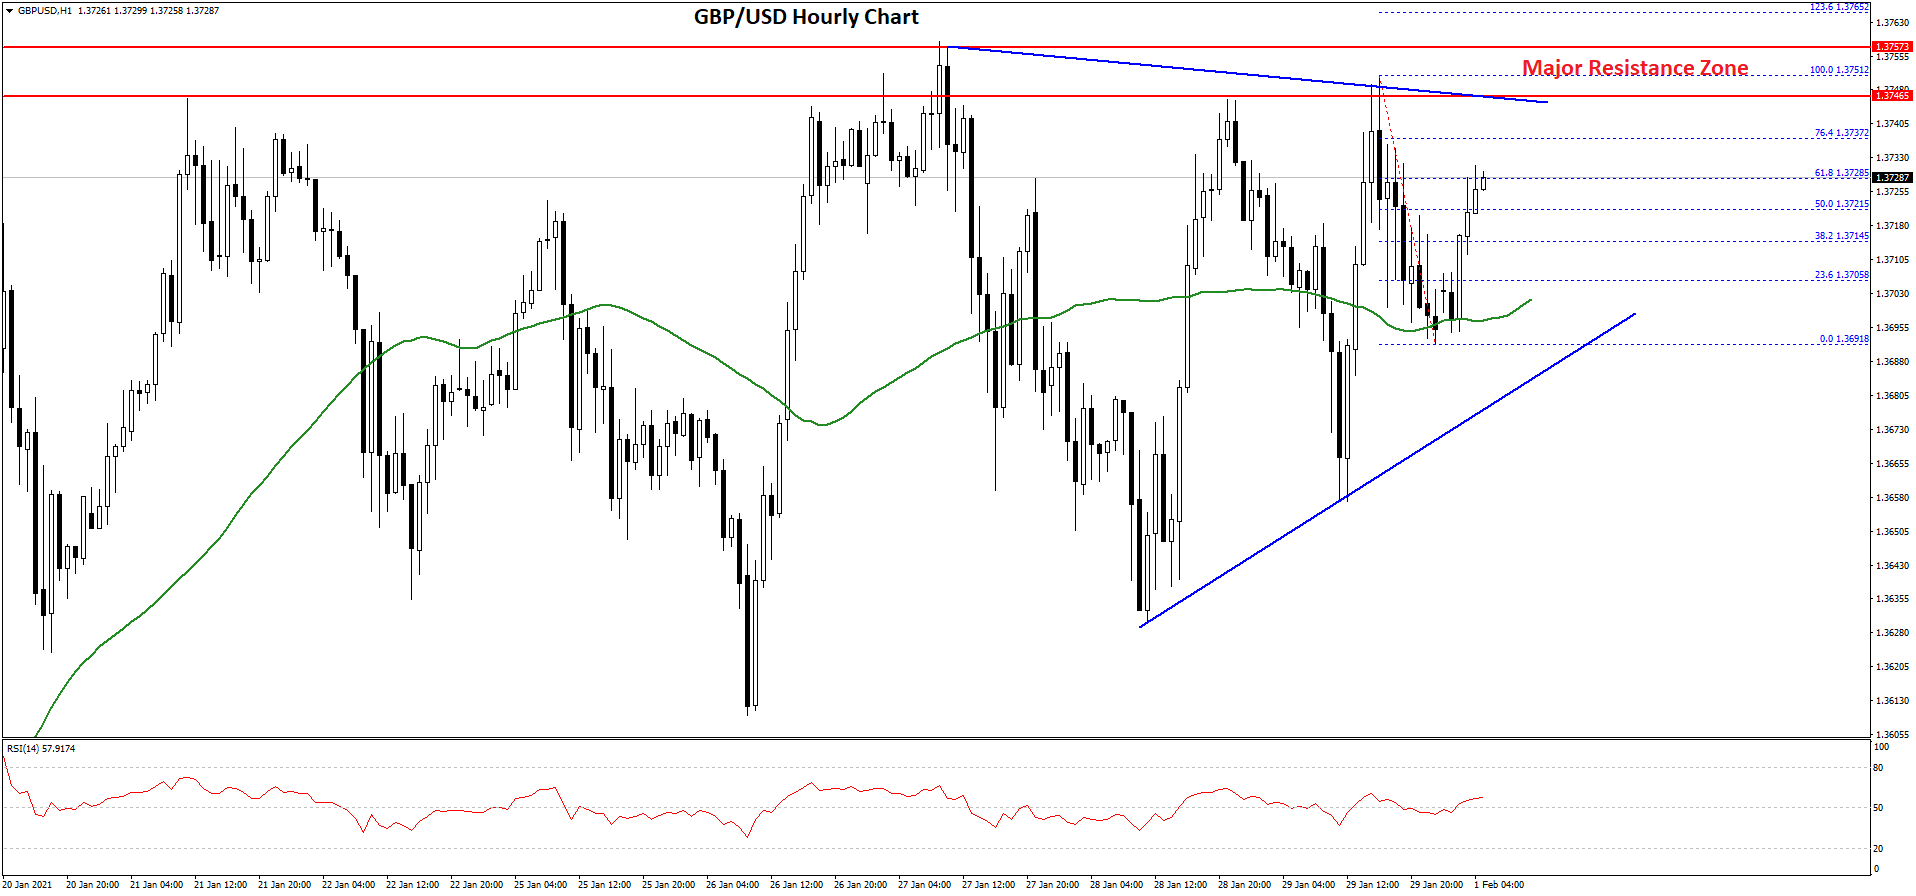
A low is formed near 1.3691 and the pair is currently rising. It broke the 50% Fib retracement level of the recent decline from the 1.3751 high to 1.3691 low.
On the upside, an initial resistance is near the 1.3738 level. It is close to the 76.4% Fib retracement level of the recent decline from the 1.3751 high to 1.3691 low. The main resistance is still near the 1.3750 zone.
To start a strong increase, the pair must clear the 1.3745 and 1.3750 resistance levels. If the bulls succeed, the pair could rise towards the 1.3850 level.
On the downside, the first key support is near the 1.3700 area. There is also a connecting bullish trend line forming with support near 1.3690 on the hourly chart of GBP/USD. If there is a break below 1.3700 and 1.3690, the pair could decline towards the 1.3620 support zone in the near term.
USD/CAD Technical Analysis
The US Dollar followed a bullish path above the 1.2800 level against the Canadian Dollar. The USD/CAD pair even broke the 1.2820 and 1.2850 resistance levels, but it struggled near the 1.2880 level.
There were two attempts by the bulls to clear 1.2880, but there was no upside break. A high was formed near 1.2874 and the pair decline below the 1.2820 support level. A low was formed near 1.2737 and the pair corrected higher.
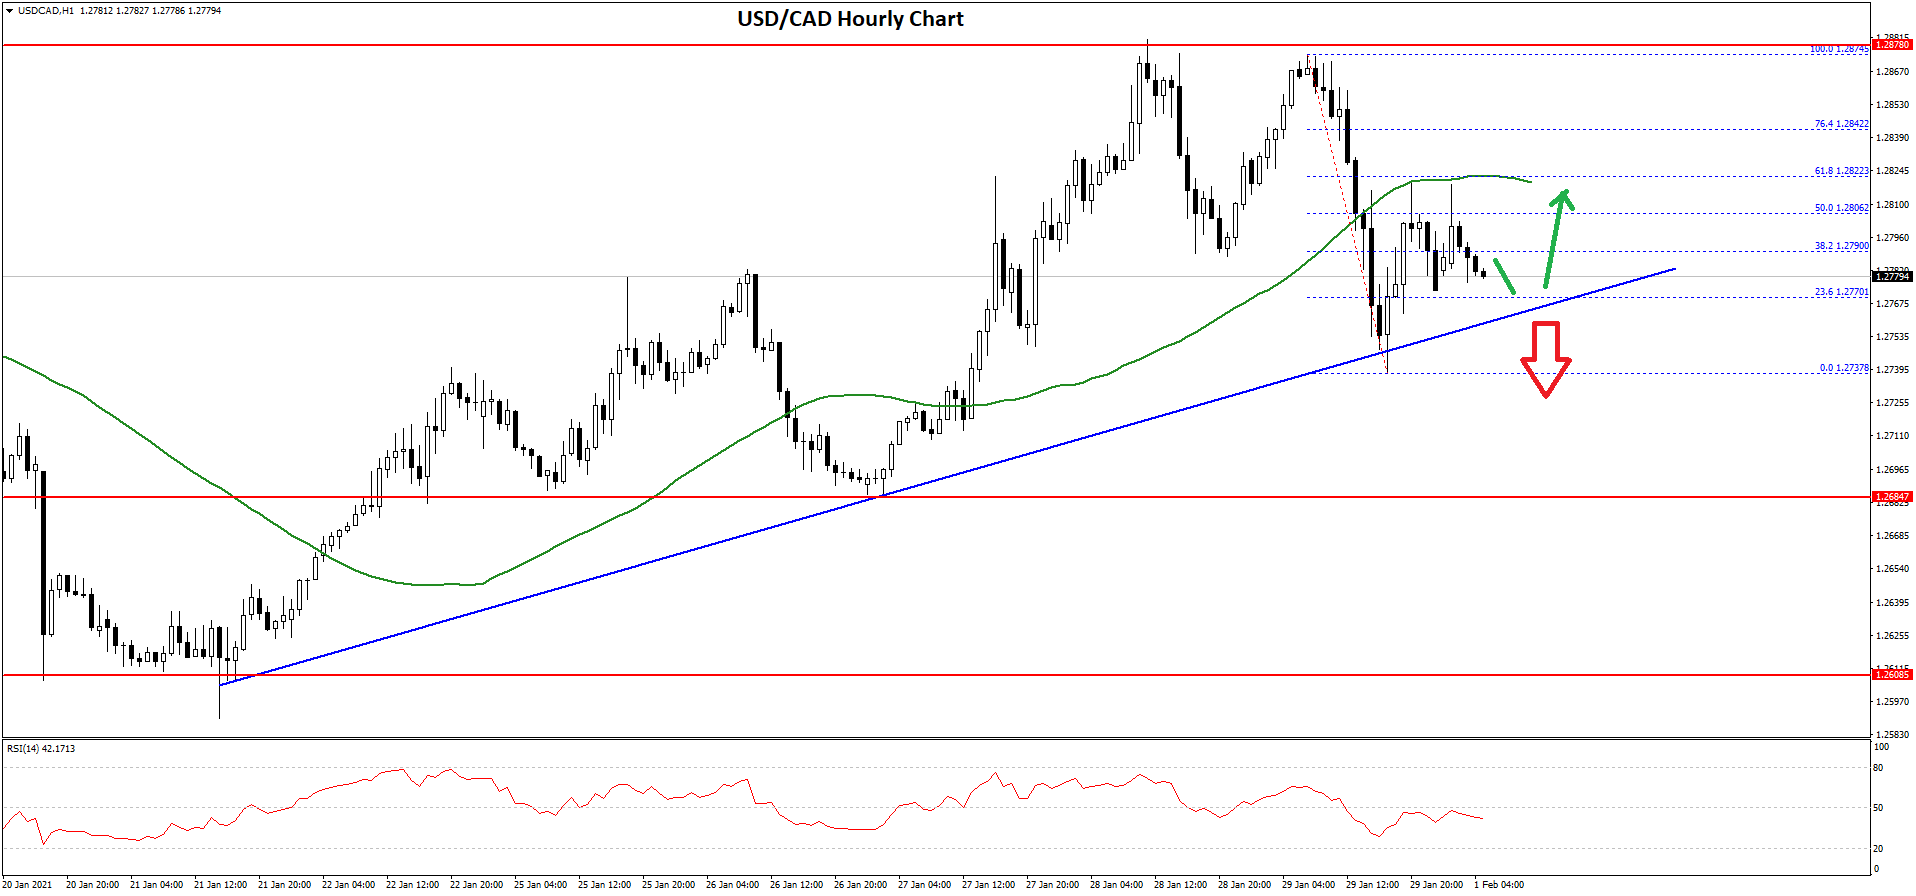
It broke the 1.2800 resistance level, plus the 50% Fib retracement level of the downward move from the 1.2874 high to 1.2737 swing low. However, the pair faced a strong resistance near the 1.2820 level and the 50 hourly simple moving average.
It also failed to clear the 61.8% Fib retracement level of the downward move from the 1.2874 high to 1.2737 swing low. The pair is currently declining and trading near the 1.2780 level.
On the downside, there is a major bullish trend line forming with support near 1.2770 on the hourly chart. If USD/CAD breaks the trend line support, there is a risk of a larger decline in the coming sessions.
The next major support is near the 1.2700 level. On the upside, the first major resistance is near the 1.2820 level and the 50 hourly simple moving average. The next key resistance is near the 1.2880 level. A clear break above the 1.2820 resistance level may possibly increase the chances of a run above 1.2880 in the near term.
Trade over 50 forex markets 24 hours a day with FXOpen. Take advantage of low commissions, deep liquidity, and spreads from 0.0 pips (additional fees may apply). Open your FXOpen account now or learn more about trading forex with FXOpen.
This article represents the opinion of the Companies operating under the FXOpen brand only. It is not to be construed as an offer, solicitation, or recommendation with respect to products and services provided by the Companies operating under the FXOpen brand, nor is it to be considered financial advice.
Stay ahead of the market!
Subscribe now to our mailing list and receive the latest market news and insights delivered directly to your inbox.


Latest articles

Amazon Earnings: Does the Chart Already Know Something the Numbers Don't?
All eyes are on July 30, when Amazon reports Q2 2026 earnings, with Wall Street increasingly convinced the bar has been set too low. Consensus sees EPS near $1.82-$2.26 on roughly $197 billion in revenue, but the

WTI Analysis: Gap Breaks Short-Term Trend as Price Remains Trapped Between the POC and Profile Boundary
WTI crude oil plunged by more than 7% on 27 July 2026 after the US suspended a series of strikes against Iran over the weekend, raising hopes of a diplomatic solution and the reopening of shipping through the Strait of

US Dollar Index: A Defining Week for the King of the Markets
The dollar heads into a pivotal week trading near 101.80, just off a 15-month high, with the Fed's July 29 meeting standing as the clear focal point. Markets currently price roughly a 65% chance of a hold, though renewed