


GBP/USD Recovering Nicely, USD/CAD is Following Downtrend
FXOpen

GBP/USD started a fresh increase above the 1.2350 resistance area. Conversely, USD/CAD declined heavily and it is now trading well below the 1.4000 pivot level.
Important Takeaways for GBP/USD and USD/CAD
- The British Pound traded as low as 1.2266 before starting a fresh increase.
- There was a break above a key bearish trend line with resistance near 1.2400 on the hourly chart of GBP/USD.
- USD/CAD declined heavily below the 1.4100 and 1.4000 support levels.
- There is a declining channel forming with resistance near 1.3925 on the hourly chart.
GBP/USD Technical Analysis
This past week, the British Pound extended its decline below the 1.2400 support area against the US Dollar. The GBP/USD pair traded to a new monthly low at 1.2266 on FXOpen before starting a fresh increase.
The pair recovered nicely above the 1.2320 and 1.2350 resistance levels. Besides, there was a break above the 1.2400 resistance area and the 50 hourly simple moving average.
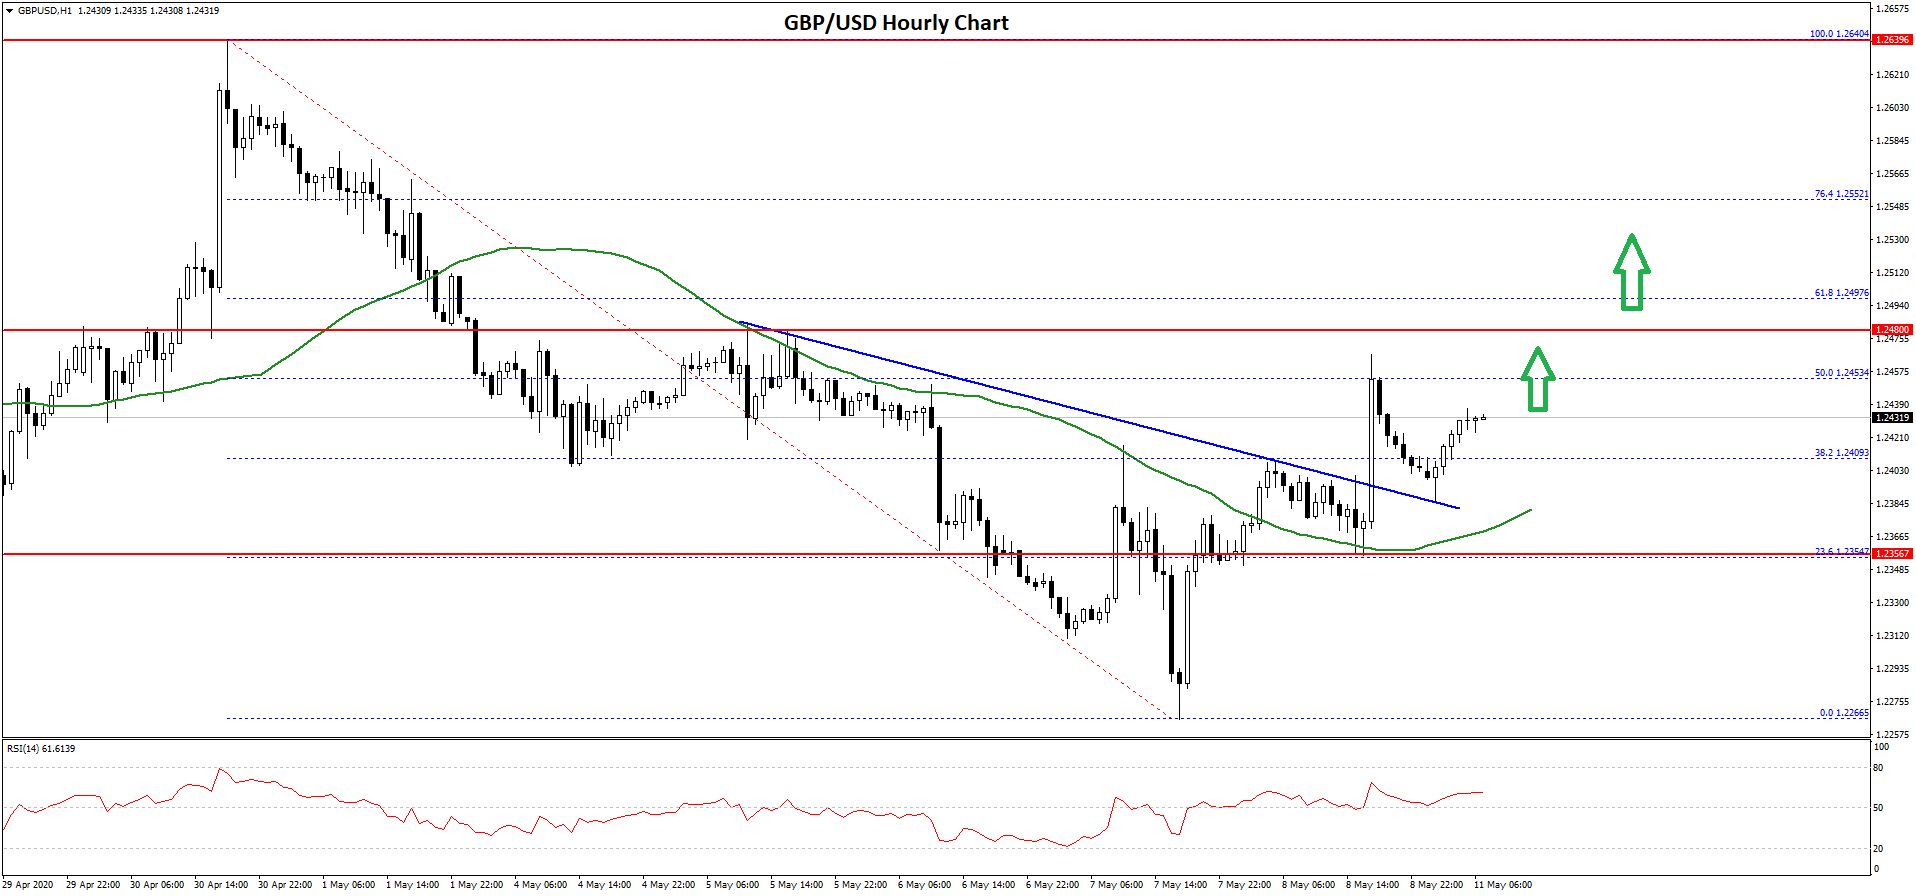
The bulls were able to lead the pair above the 38.2% Fib retracement level of the downward move from the 1.2640 high to 1.2266 low. More importantly, there was a break above a key bearish trend line with resistance near 1.2400 on the hourly chart of GBP/USD.
The pair traded above the 1.2420 level and tested the 50% Fib retracement level of the downward move from the 1.2640 high to 1.2266 low. It is currently trading nicely above the 1.2400 level and it seems like the bulls are likely to aim an upside break above the 1.2460 and 1.2480 resistance levels.
The next major resistance is near 1.2500, above which the pair could continue to rise towards the 1.2560 level. On the downside, there is a major support forming near the 1.2380 level and the 50 hourly simple moving average.
If GBP/USD fails to stay above 1.2380 and 1.2350, there is a risk of more losses below the 1.2320 and 1.2300 levels in the near term.
USD/CAD Technical Analysis
The US Dollar formed a key top near the 1.4170 level and started a strong decline against the Canadian Dollar. The USD/CAD pair broke a few important supports near 1.4050 to enter a bearish zone.
To initiate the decline, there was a break below a major bullish trend line with support at 1.4070 on the hourly chart. Besides, there was a close below the 1.4000 support and the 50 hourly simple moving average.
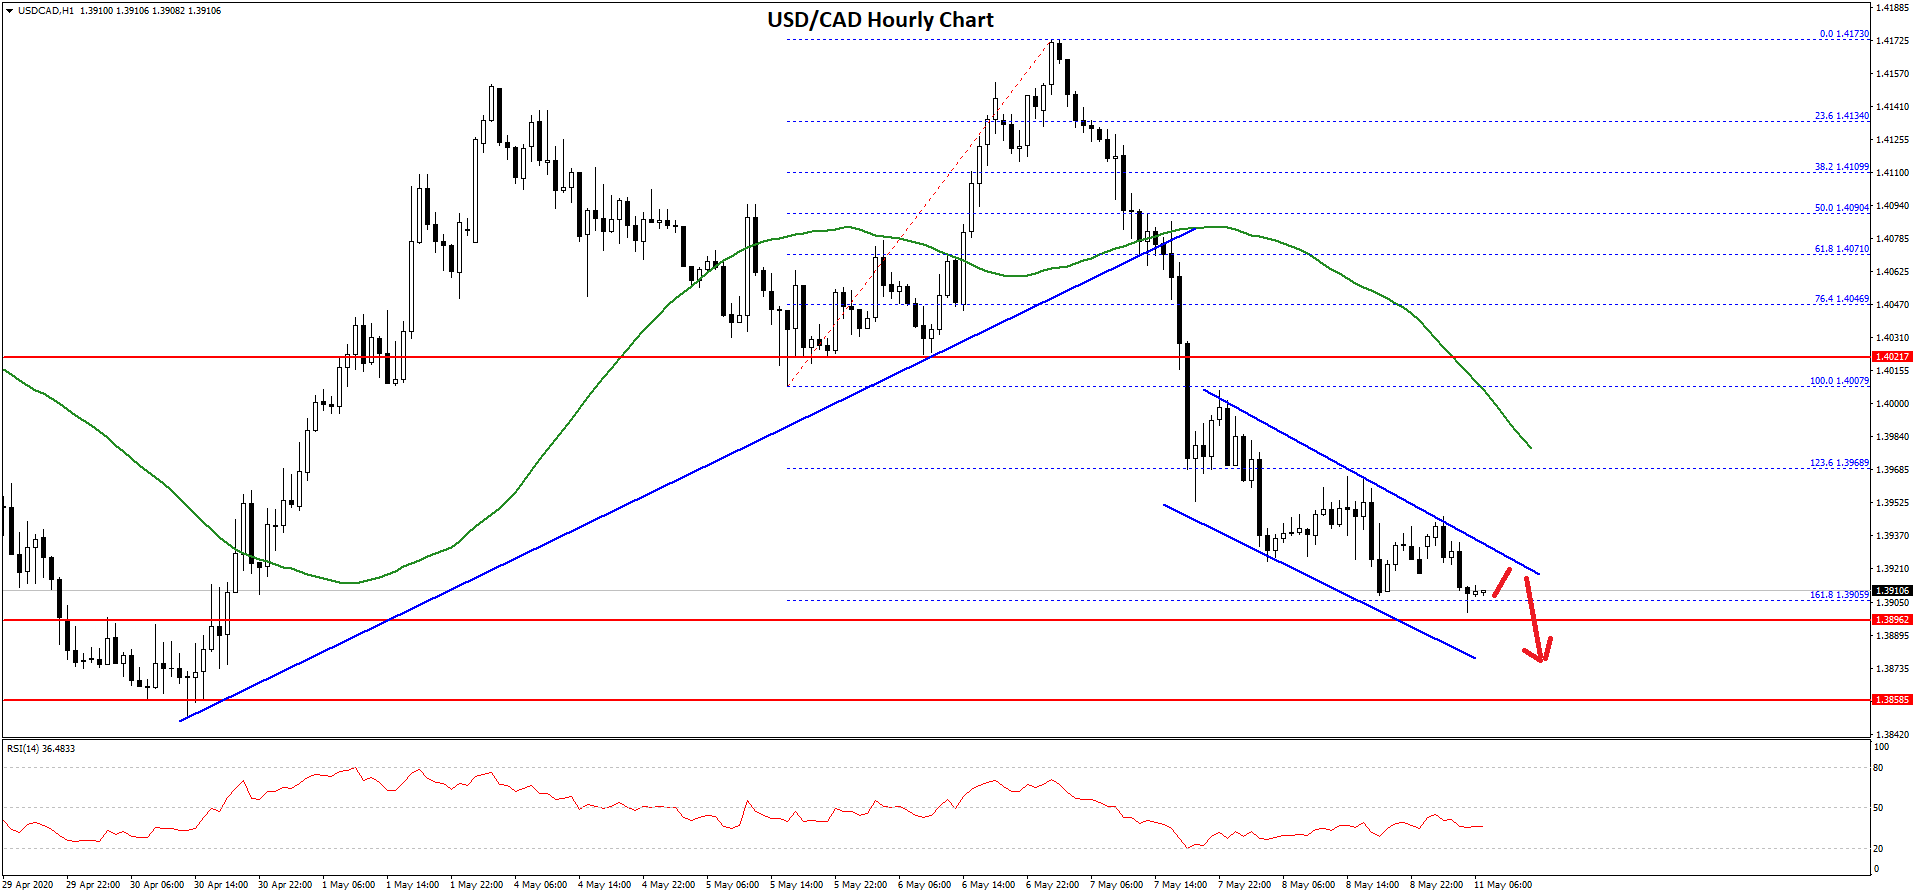
The pair even broke the 1.236 Fib extension level of the upward move from the 1.4007 low to 1.4173 high. It seems like there is now a declining channel forming with resistance near 1.3925 on the hourly chart.
The pair is testing the 1.618 Fib extension level of the upward move from the 1.4007 low to 1.4173 high. If there is a downside break below the 1.3900 level, the pair could extend its decline below the 1.3880 and 1.3850 levels.
On the upside, an initial resistance is near the 1.3925 and 1.3930 levels. The main resistance is near the 1.3980 level and the 50 hourly simple moving average.
If USD/CAD breaks the channel resistance and gains pace above 1.3950, it could even recover above 1.3980. In the mentioned case, the bulls are likely to aim a test of 1.4000 and 1.4020.
Trade over 50 forex markets 24 hours a day with FXOpen. Take advantage of low commissions, deep liquidity, and spreads from 0.0 pips (additional fees may apply). Open your FXOpen account now or learn more about trading forex with FXOpen.
This article represents the opinion of the Companies operating under the FXOpen brand only. It is not to be construed as an offer, solicitation, or recommendation with respect to products and services provided by the Companies operating under the FXOpen brand, nor is it to be considered financial advice.
Stay ahead of the market!
Subscribe now to our mailing list and receive the latest market news and insights delivered directly to your inbox.


Latest articles

EUR/USD Eyes Gains As USD/CHF Weakness Deepens Again
EUR/USD started a fresh increase above 1.1700 and 1.1720. USD/CHF declined further and is now struggling below 0.7835.
Important Takeaways for EUR/USD and USD/CHF Analysis Today
· The Euro started a decent increase from

Apple: Earnings Day Above the Activity Zone
On 30 April, after the market close, Apple Inc. will release its financial results for the second quarter of fiscal 2026. The consensus forecast, based on estimates from 31 analysts, points to revenue of around $109.7 billion, with expected

USD/JPY and USD/CHF Near Key Levels: The Dollar Supported by the Fed
The US dollar continues to trend upwards following the Federal Reserve meeting, drawing support from the regulator’s moderately hawkish stance and comments by Jerome Powell. Markets interpret the Fed’s rhetoric as a signal that restrictive policy is likely