


GBP/USD Recovering While USD/CAD Correcting Lower
FXOpen
GBP/USD declined close to 1.2860 and recently started an upside correction. USD/CAD climbed towards the 1.3500 level and it is currently correcting lower.
Important Takeaways for GBP/USD and USD/CAD
- The British Pound declined heavily and tested the 1.2850-1.2860 support area.
- There is an ascending channel in place with support at 1.2910 on the hourly chart of GBP/USD.
- USD/CAD climbed higher sharply and traded above the 1.3400 and 1.3450 resistances.
- The pair is correcting lower and recently broke a key bullish trend line with support at 1.3475 on the hourly chart.
GBP/USD Technical Analysis
The British Pound remained in a bearish zone and declined sharply from the 1.3020 resistance against the US Dollar. The GBP/USD pair broke the 1.3000 and 1.2920 support levels to move into a bearish zone.
The decline was such that the pair even broke the 1.2900 level and the 50 hourly simple moving average. It traded close to the 1.2850 level and formed a swing low at 1.2867 on FXOpen.
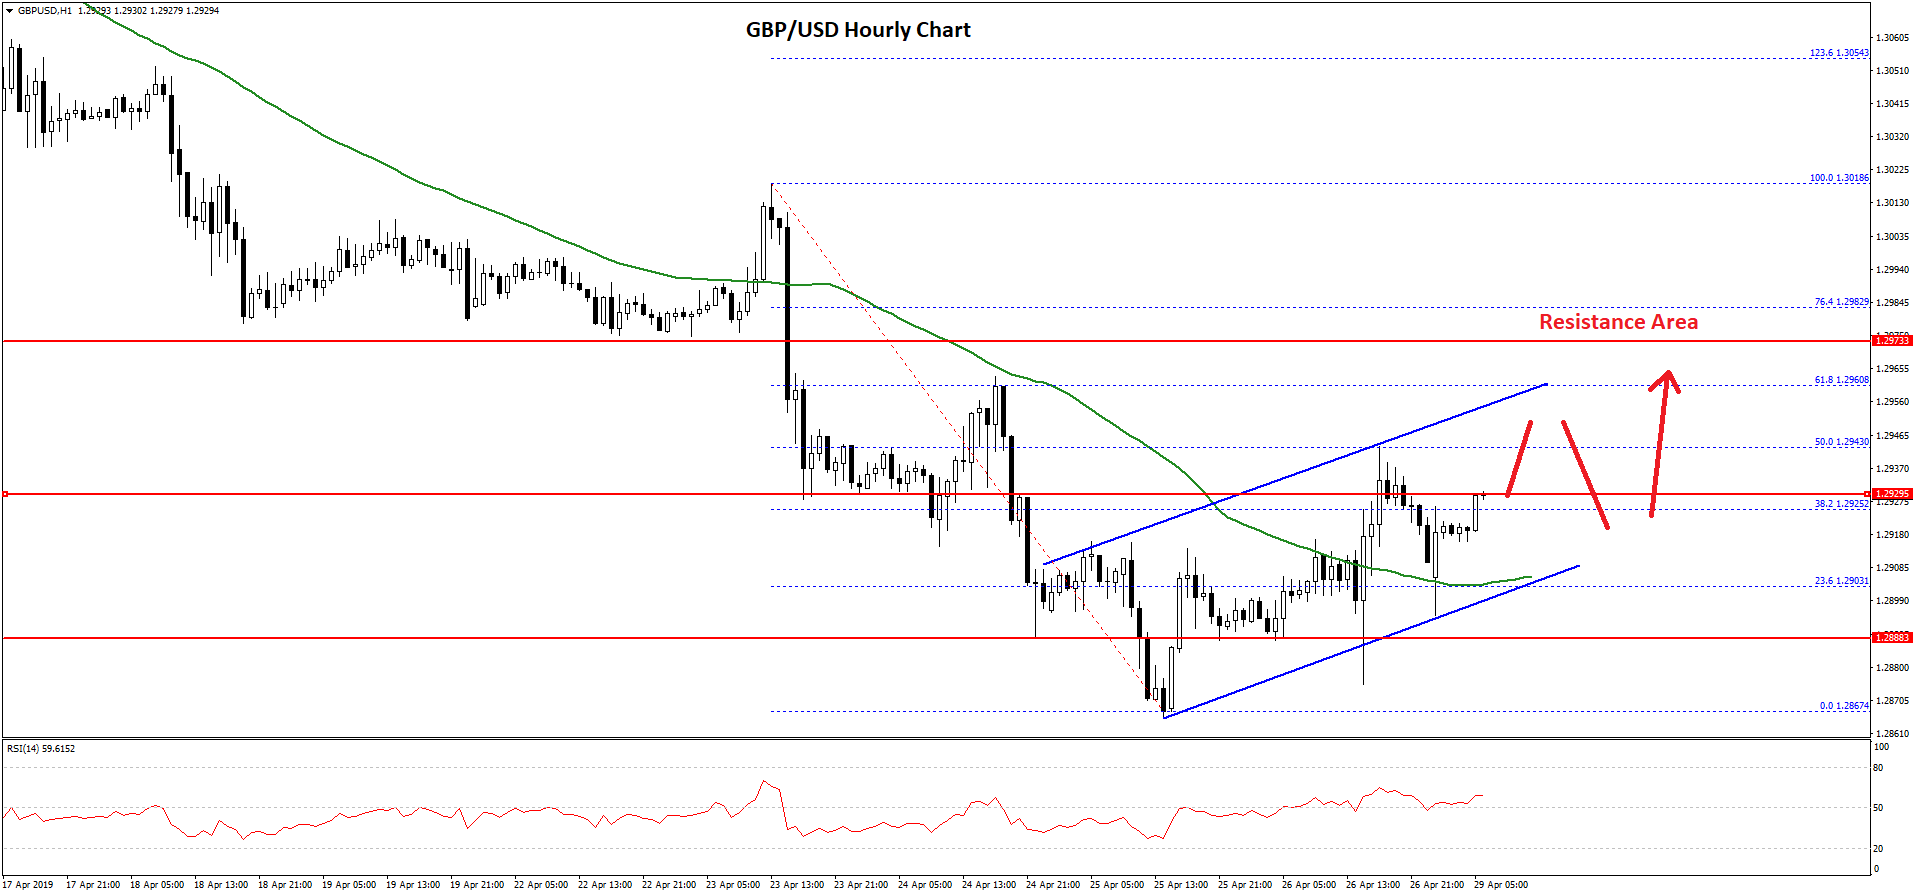
Recently, it started an upside correction above the 1.2900 level and the 50 hourly simple moving average. There was a break above the 38.2% Fib retracement level of the last decline from the 1.3018 high to 1.2867 low.
However, the upward move was capped by the 1.2940 level and the 50% Fib retracement level of the last decline from the 1.3018 high to 1.2867 low.
The pair retreated from highs and retest the 1.2900 zone and the 50 hourly SMA. At the outset, the pair is moving higher and is following an ascending channel with support at 1.2910 on the hourly chart.
On the upside, there is a strong resistance near the 1.2940 and 1.2950 levels. A successful close above the 1.2950 level may push the pair towards the 1.3000 and 1.3020 levels. On the downside, an immediate support is at 1.2920, followed by the channel support.
If GBP/USD settles below 1.2910 and 1.2900, it could start a fresh decline towards the 1.2860 and 1.2850 support levels in the near term.
USD/CAD Technical Analysis
The US Dollar started a strong upward move after forming a support base near 1.3300 against the Canadian Dollar. The USD/CAD pair climbed above the 1.3400 resistance level and gained bullish momentum.
The pair surged above the 1.3450 level and the 50 hourly simple moving average. It even spiked above the 1.3500 level and formed a high at 1.3521. Recently, it started a downside correction below the 1.3500 level and the 50 hourly simple moving average.
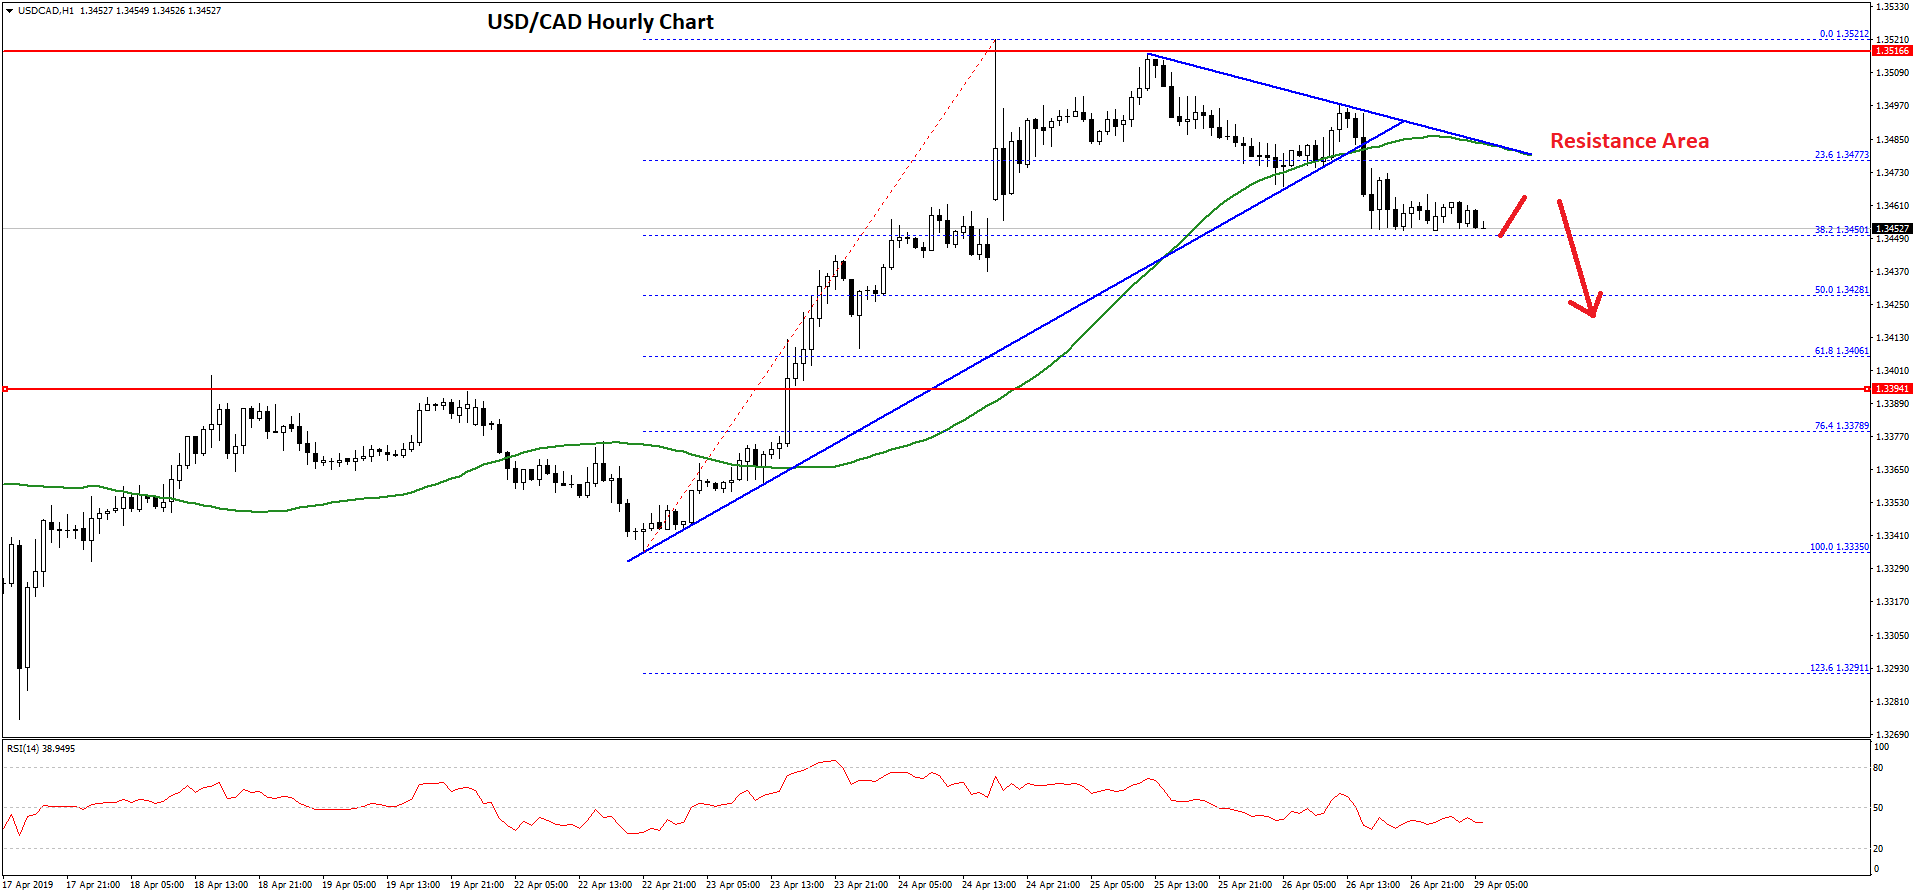
It even broke a key bullish trend line with support at 1.3475 on the hourly chart. The pair broke the 1.3460 level and tested the 38.2% Fib retracement level of the last wave from the 1.3335 low to 1.3521 high.
At the moment, the pair is consolidating above the 1.3450 level. If there is a downside break below the 1.3450 level, the pair could test the 1.3428 level or the 50% Fib retracement level of the last wave from the 1.3335 low to 1.3521 high.
Any further declines may push USD/CAD towards the 1.3400 support level. On the upside, an initial resistance is near the 1.3480 level, the 50 hourly SMA, and a connecting bearish trend line.
A successful close above 1.3480 is likely to start a fresh increase above the 1.3500 and 1.3510 levels in the coming sessions.
Trade over 50 forex markets 24 hours a day with FXOpen. Take advantage of low commissions, deep liquidity, and spreads from 0.0 pips (additional fees may apply). Open your FXOpen account now or learn more about trading forex with FXOpen.
This article represents the opinion of the Companies operating under the FXOpen brand only. It is not to be construed as an offer, solicitation, or recommendation with respect to products and services provided by the Companies operating under the FXOpen brand, nor is it to be considered financial advice.
Stay ahead of the market!
Subscribe now to our mailing list and receive the latest market news and insights delivered directly to your inbox.


Latest articles

US Dollar Strengthens Amid Equity Market Weakness and Hawkish Fed Rhetoric
The US dollar continues to hold firm near multi-year highs as sentiment across equity markets deteriorates and investors increasingly expect the Federal Reserve to maintain a restrictive monetary policy stance for longer. The US economy remains resilient, while inflation risks

Bitcoin: Corrective Channel Broken as Traders Turn More Active
Bitcoin has come under the influence of several factors simultaneously. The wave of selling at the beginning of June was linked to Strategy's first disclosed Bitcoin sale in several years, a prolonged series of outflows from spot ETFs, and a

DAX 40: consolidation amid technology sell-off
A wave of selling in the technology sector that emerged earlier this week has weighed on European equities. The trigger was investor concern over the profitability of large-scale debt-funded investments by major US tech companies in AI infrastructure. The Nasdaq