


GBP/USD Recovers, EUR/GBP Eyes More Upsides
FXOpen
GBP/USD started a fresh increase above the 1.1550 zone. EUR/GBP is rising and might climb further higher above the 0.8700 resistance.
Important Takeaways for GBP/USD and EUR/GBP
· The British Pound started a fresh recovery wave above the 1.1550 resistance zone against the US Dollar.
· There is a key bullish trend line forming with support near 1.1585 on the hourly chart of GBP/USD.
· EUR/GBP climbed higher above the 0.8620 and 0.8650 resistance levels.
· There is a major bullish trend line forming with support near 0.8665 on the hourly chart.
GBP/USD Technical Analysis
The British Pound found support near the 1.1420 zone against the US Dollar. The GBP/USD pair started a recovery wave and was able to clear the 1.1500 resistance zone.
There was a decent increase above the 1.1550 level and the 50 hourly simple moving average. The pair even climbed above the 1.1600 level. A high was formed near 1.1641 on FXOpen and the pair is now correcting gains.
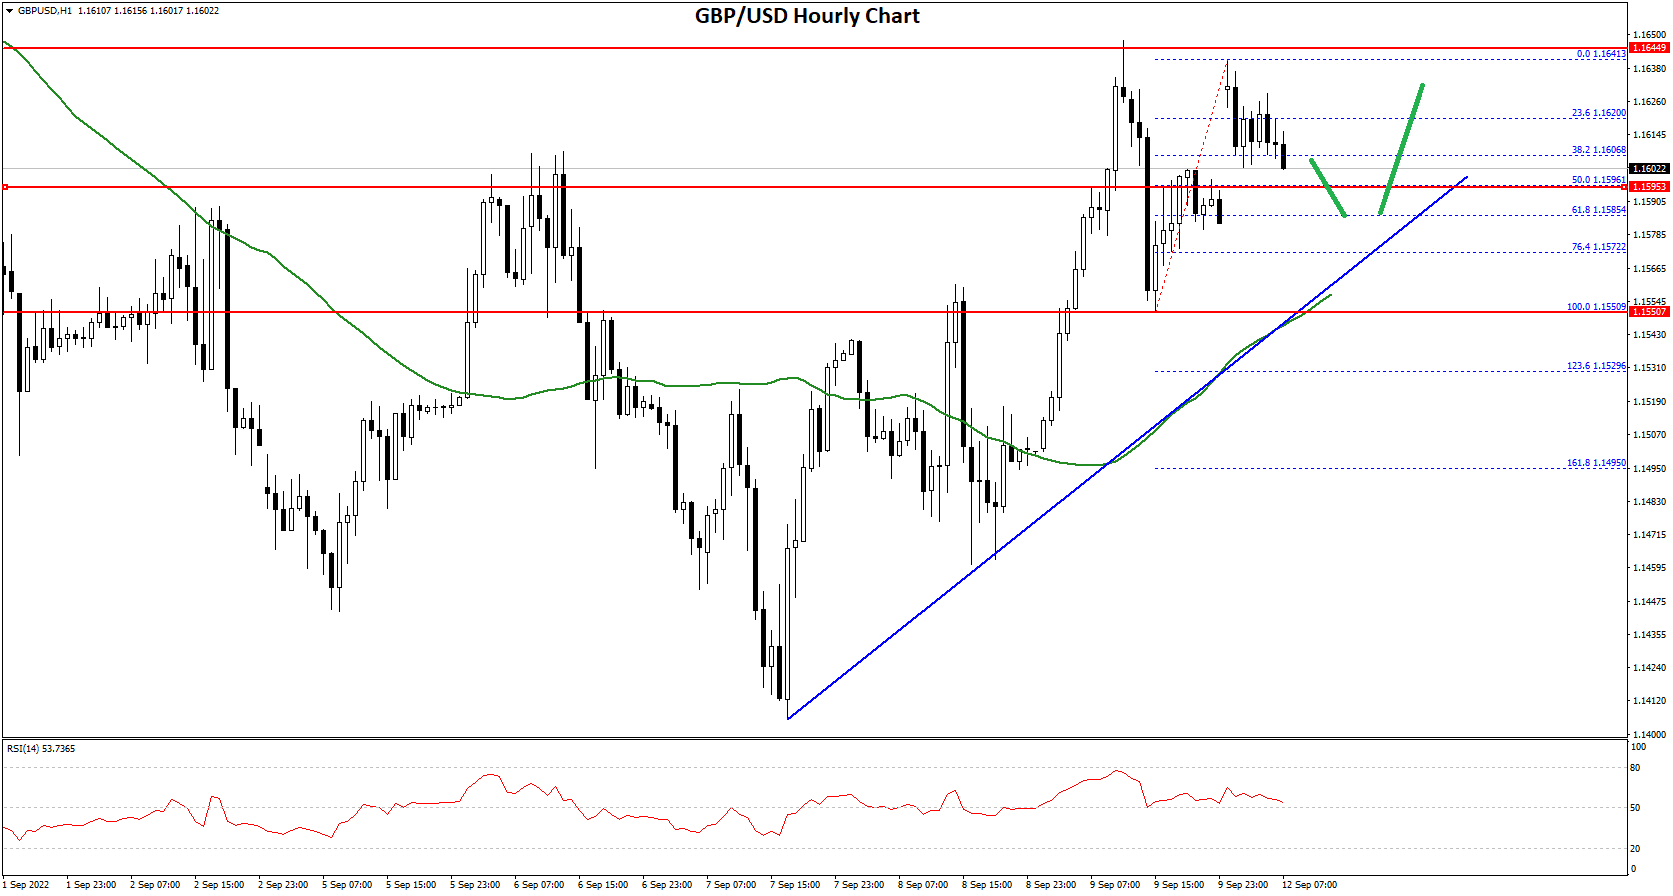
There was a move below the 1.1620 level. The pair declined below the 23.6% Fib retracement level of the upward move from the 1.1550 swing low to 1.1641 high.
On the downside, an initial support is near the 1.1600 level. It is near the 50% Fib retracement level of the upward move from the 1.1550 swing low to 1.1641 high. There is also a key bullish trend line forming with support near 1.1585 on the hourly chart of GBP/USD.
The next major support is near the 1.1550 level. Any more losses could lead the pair towards the 1.1500 support zone or even 1.1420.
On the upside, an initial resistance is near the 1.1640 level. The next main resistance is near the 1.1650 zone. A clear upside break above the 1.1640 and 1.1650 resistance levels could open the doors for a steady increase in the near term. The next major resistance sits near the 1.1715 level.
EUR/GBP Technical Analysis
The Euro formed a base above the 0.8565 level against the British Pound. The EUR/GBP pair started a fresh increase and was able to clear the 0.8600 resistance zone.
The pair even traded above the 0.8650 level and the 50 hourly simple moving average. It traded as high as 0.8711 and is currently correcting lower. There was a move below the 23.6% Fib retracement level of the upward move from the 0.8566 swing low to 0.8711 high.
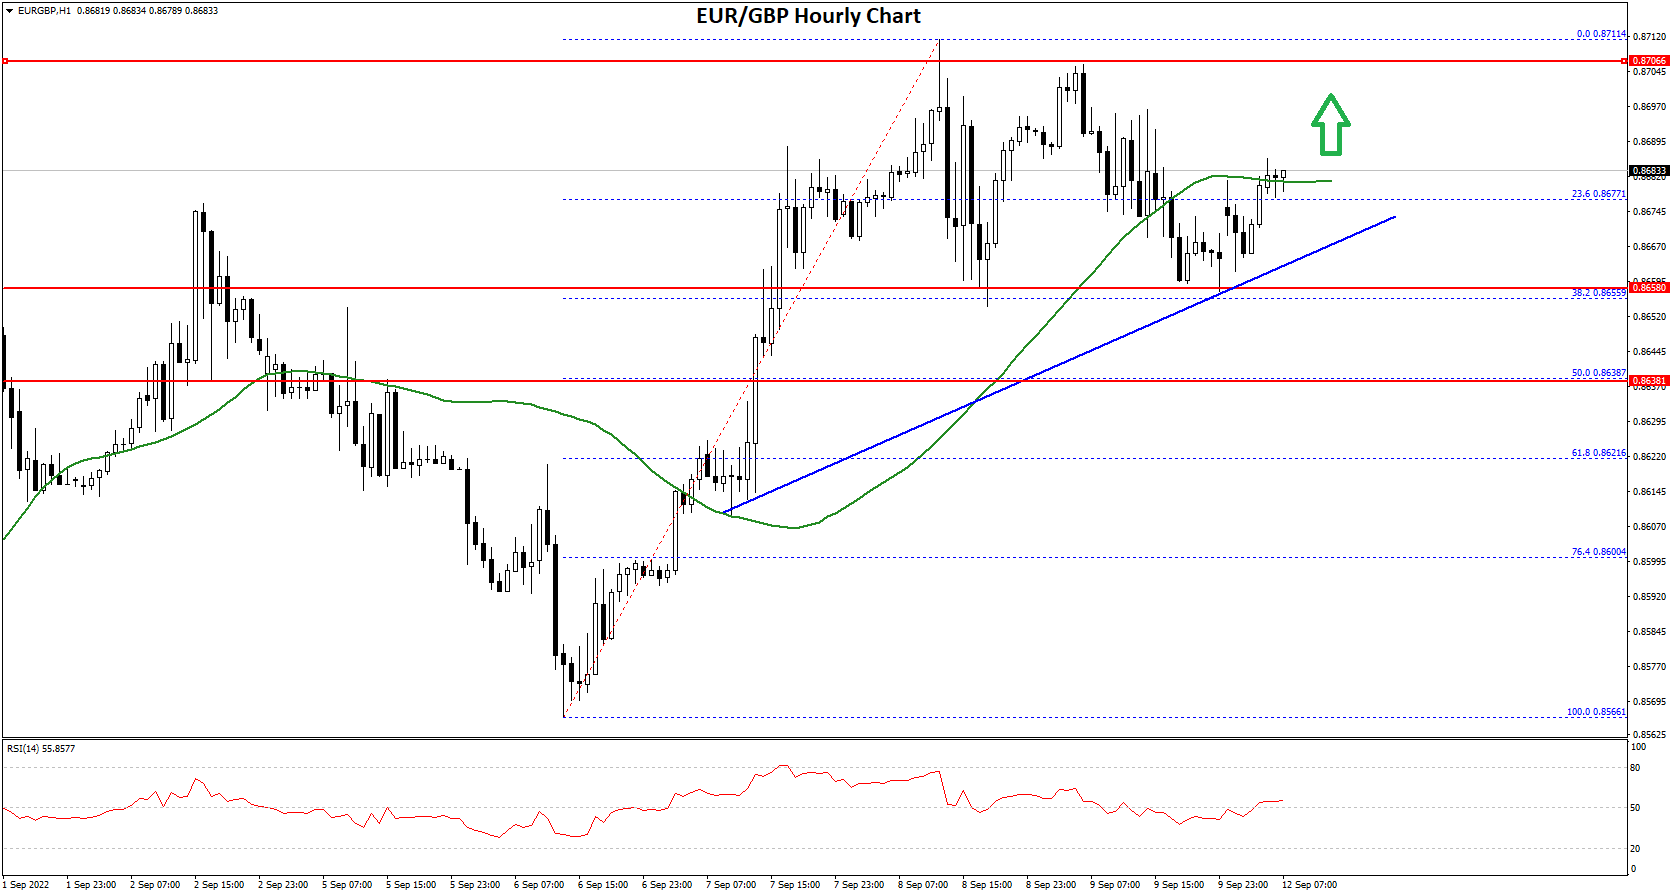
On the downside, an initial support is near the 0.8670 level. There is also a major bullish trend line forming with support near 0.8665 on the hourly chart.
The next major support is near 0.8640. It is near the 50% Fib retracement level of the upward move from the 0.8566 swing low to 0.8711 high. A downside break below the 0.8640 support might call for more downsides.
In the stated case, the pair could decline towards the 0.8610 support level in the near term. On the upside, an immediate resistance is near the 0.8700 level.
The next major resistance for the bulls is near the 0.8710 level. A clear move above the 0.8710 resistance might push the price higher towards the 0.8750 level.
This forecast represents FXOpen Markets Limited opinion only, it should not be construed as an offer, invitation or recommendation in respect to FXOpen Markets Limited products and services or as financial advice.
Trade over 50 forex markets 24 hours a day with FXOpen. Take advantage of low commissions, deep liquidity, and spreads from 0.0 pips (additional fees may apply). Open your FXOpen account now or learn more about trading forex with FXOpen.
This article represents the opinion of the Companies operating under the FXOpen brand only. It is not to be construed as an offer, solicitation, or recommendation with respect to products and services provided by the Companies operating under the FXOpen brand, nor is it to be considered financial advice.
Stay ahead of the market!
Subscribe now to our mailing list and receive the latest market news and insights delivered directly to your inbox.


Latest articles

Nasdaq 100: Is This the Correction Traders Have Been Waiting For?
The Nasdaq 100 (US Tech 100 Mini on FXOpen) remains caught between two opposing forces: cooling inflation on one side, and persistent geopolitical instability on the other. On 14 July, June's CPI print came in softer than expected, easing near-term
XRP/USD: Symmetrical Triangle Forms as Trading Volume Fades
On 6 July, Ripple received a full Crypto-Asset Service Provider (CASP) licence under the Markets in Crypto-Assets (MiCA) regulation from Luxembourg's financial regulator, the CSSF. The approval allows the company to offer regulated crypto payment services across all 30 countries

AI Valuations Are Back in the Spotlight
Artificial intelligence remains the dominant investment theme of 2026, but investors are increasingly questioning whether AI stock valuations are keeping pace with reality.
💰 Big Tech continues to invest at an unprecedented scale, with hyperscaler AI spending projected to exceed $800