


GBP/USD Remains At Risk, EUR/GBP Could Extend Gains
FXOpen
GBP/USD is trading in a bearish zone below the 1.3750 resistance zone. EUR/GBP is rising and it could gain pace if it clears the 0.8600 resistance.
Important Takeaways for GBP/USD and EUR/GBP
· The British Pound declined below the 1.3800 and 1.3765 support levels.
· There is a key contracting triangle forming with resistance near 1.3685 on the hourly chart of GBP/USD.
· EUR/GBP started a decent increase and cleared the 0.8550 pivot level.
· There was a break above a major bearish trend line with resistance near 0.8565 on the hourly chart.
GBP/USD Technical Analysis
The British Pound started a major decline from well above 1.3800 against the US Dollar. The GBP/USD pair traded below the 1.3720 and 1.3700 support levels to enter a bearish zone.
The pair even broke the 1.3650 support and settled below the 50 hourly simple moving average. It traded as low as 1.3609 and recently started an upside correction. The pair climbed above the 1.3700 resistance, but the bears were active near 1.3750.
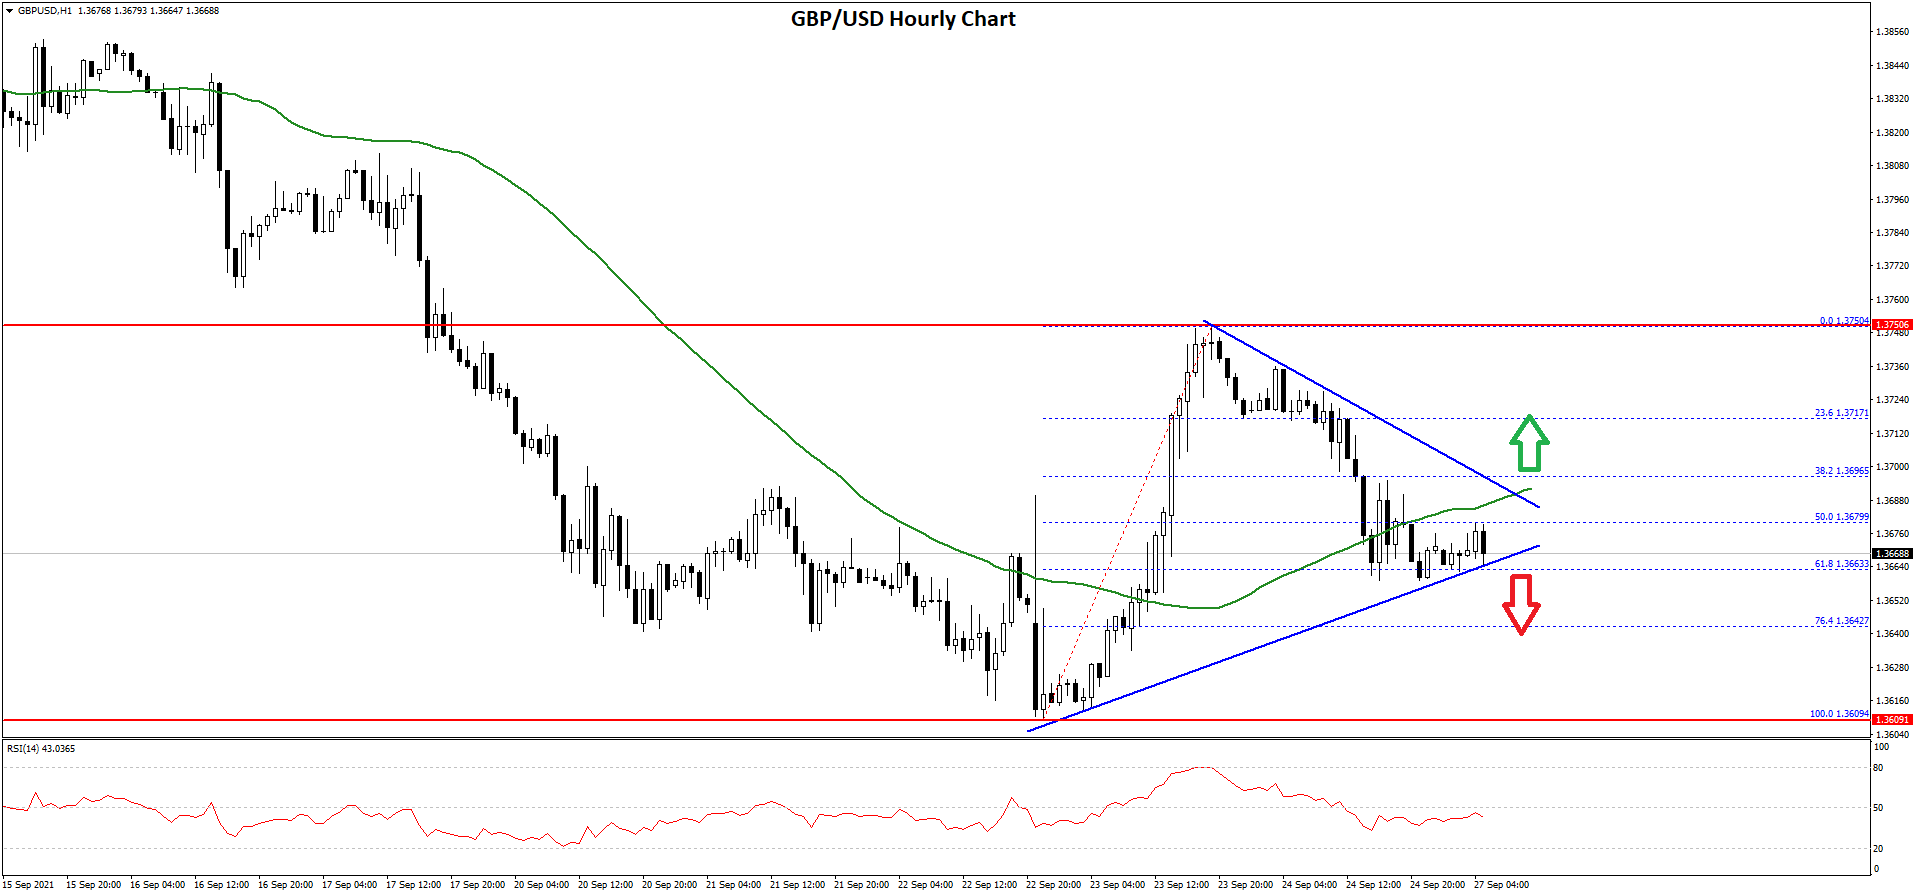
A high was formed near 1.3750 before the pair started a downside correction. There was a break below the 1.3700 support level. It traded below the 50% Fib retracement level of the upward move from the 1.3609 swing low to 1.3750 high.
It is now consolidating near the 1.3665 support level. It is close to the 61.8% Fib retracement level of the upward move from the 1.3609 swing low to 1.3750 high. There is also a key contracting triangle forming with resistance near 1.3685 on the hourly chart of GBP/USD.
If there is an upside break above the triangle resistance, the price could surpass 1.3720. The main resistance is near the 1.3750 zone. Therefore, a proper break above the 1.3750 resistance could open the doors for a steady increase. The next major resistance for the bulls could be 1.3800.
If not, the pair could break the 1.3665 and 1.3660 support levels to continue lower. The first key support is near the 1.3620 level. Any more losses could lead the pair towards the 1.3550 support zone.
EUR/GBP Technical Analysis
The Euro started a strong increase after it settled above the 0.8500 zone against the British Pound. The EUR/GBP pair surpassed the 0.8565 resistance level and it even spiked above 0.8600.
A high was formed near 0.8612 before there was a bearish wave. The pair traded as low as 0.8536 before it started a fresh increase. There was a break above the 0.8550 and 0.8560 levels.
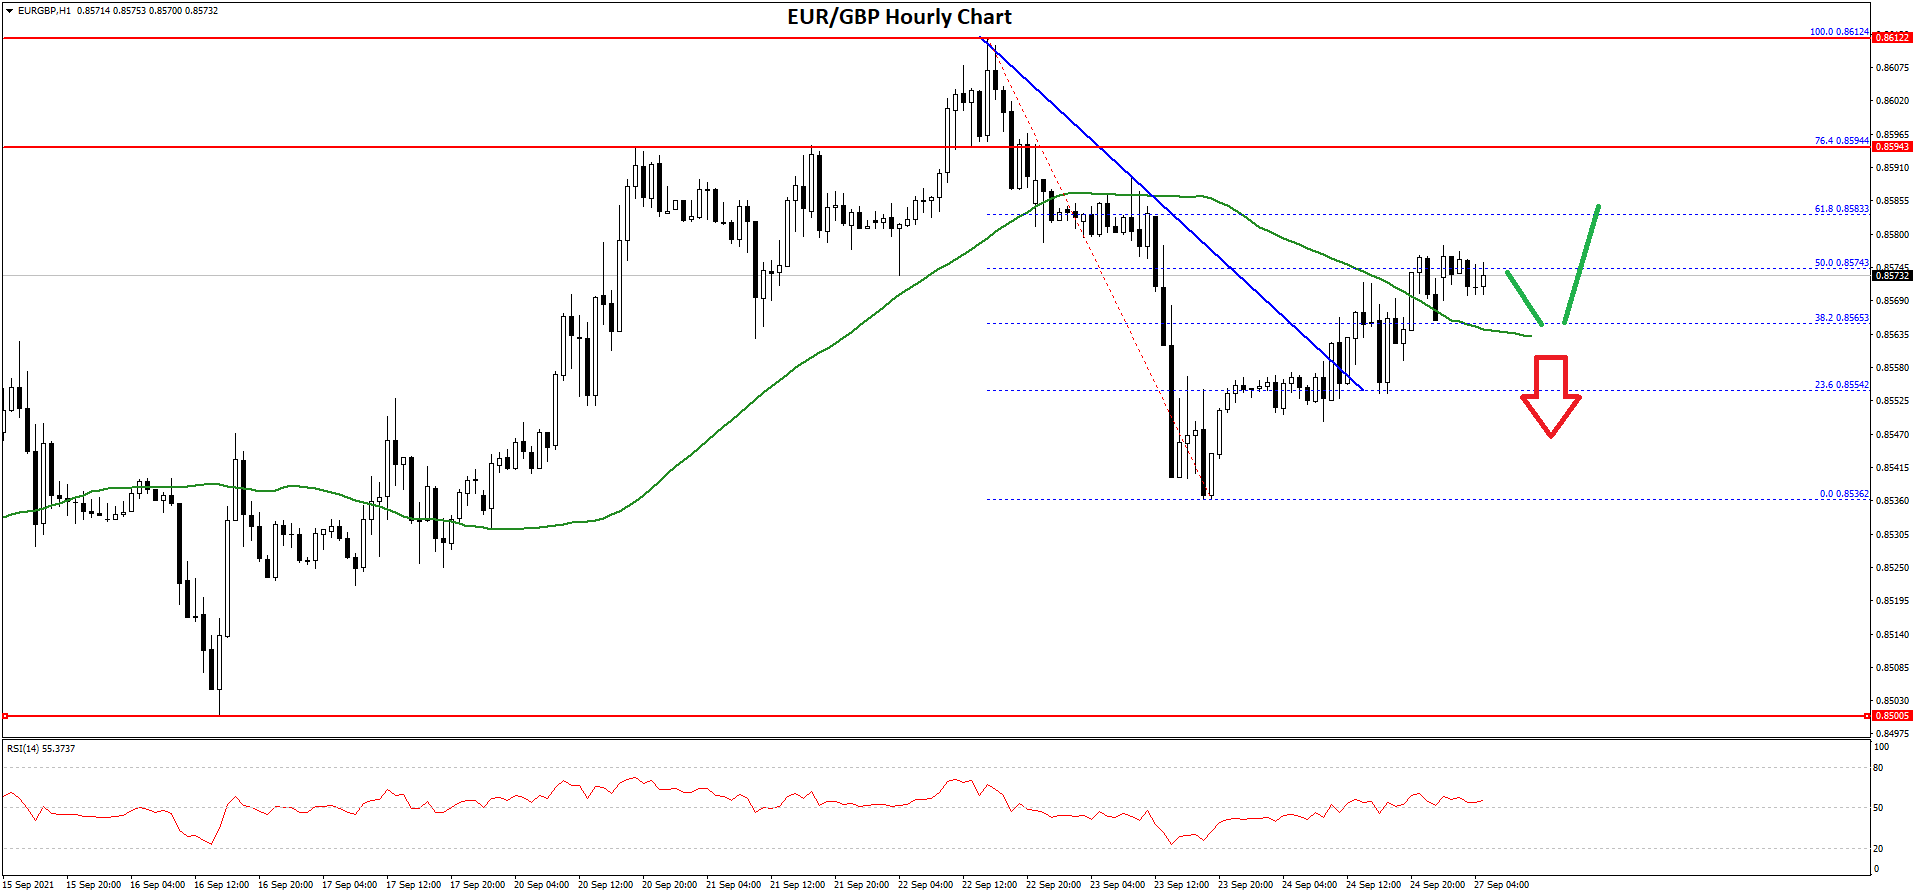
Besides, there was a break above a major bearish trend line with resistance near 0.8565 on the hourly chart. The pair is back above the 0.8565 level and the 50 hourly simple moving average. It is trading near the 50% Fib retracement level of the downward move from the 0.8612 high to 0.8536 low.
An immediate resistance is near the 0.8595 level. It is close to the 76.4% Fib retracement level of the downward move from the 0.8612 high to 0.8536 low.
The main resistance is near the 0.8600 zone, above which pair could rise steadily. An initial support on the downside is near the 0.8560 level. The next major support is near 0.8550 level. A downside break below the 0.8560 and 0.8550 support levels might call for more downsides. In the stated case, the pair could decline towards the 0.8500 support level in the near term.
This forecast represents FXOpen Markets Limited opinion only, it should not be construed as an offer, invitation or recommendation in respect to FXOpen Markets Limited products and services or as financial advice.
Trade over 50 forex markets 24 hours a day with FXOpen. Take advantage of low commissions, deep liquidity, and spreads from 0.0 pips (additional fees may apply). Open your FXOpen account now or learn more about trading forex with FXOpen.
This article represents the opinion of the Companies operating under the FXOpen brand only. It is not to be construed as an offer, solicitation, or recommendation with respect to products and services provided by the Companies operating under the FXOpen brand, nor is it to be considered financial advice.
Stay ahead of the market!
Subscribe now to our mailing list and receive the latest market news and insights delivered directly to your inbox.


Latest articles
DAX 40: Can the Index Print Fresh Record Highs Once Again?
The DAX 40 has shed more than 2% over the past several sessions, breaking a rally that had pushed the index to record highs on the back of Germany's fiscal pivot toward defence, infrastructure and climate spending. The pullback raises

US Dollar Consolidates Ahead of FOMC Minutes Release
The US dollar has entered a period of consolidation following last week's sharp price swings, as market participants turn their attention to the release of the Federal Reserve's latest meeting minutes. Investors are looking for additional guidance on the future

EUR/USD Analysis: Who Is in Control?
Two central banks, two hawkish tones — but only one dollar just took a hit. The ECB delivered a 25bp hike in June, its first since 2023, lifting the deposit rate to 2.25% as Middle East-driven energy costs pushed headline