


GBP/USD Remains Buy on Dips and EURGBP Sell on Rallies
FXOpen
GBP/USD gained momentum recently and broke the 1.2750 and 1.2800 resistance levels. EUR/GBP declined heavily and broke the 0.8960 and 0.8950 supports.
Important Takeaways for GBP/USD and EUR/GBP
- The British Pound traded with a bullish bias recently and climbed above the 1.2800 barrier.
- There is a connecting resistance trend line in place at 1.2875 on the hourly chart of GBP/USD.
- EUR/GBP declined heavily and traded below the 0.9000 and 0.8960 support levels.
- There was a break below a major bullish trend line with support at 0.9025 on the hourly chart.
GBP/USD Technical Analysis
The British Pound started a solid upward move from the 1.2500 support area against the US Dollar. The GBP/USD pair climbed above the 1.2600 and 1.2750 resistance levels to move into a positive zone.
The pair even surged above the 1.2850 level and traded close to the 1.2870 level on FXOpen. A high was formed at 1.2865 and the pair is currently correcting lower. An initial support is near the 1.2825 level and the 23.6% Fib retracement level of the last wave from the 1.2710 low to 1.2865 high.
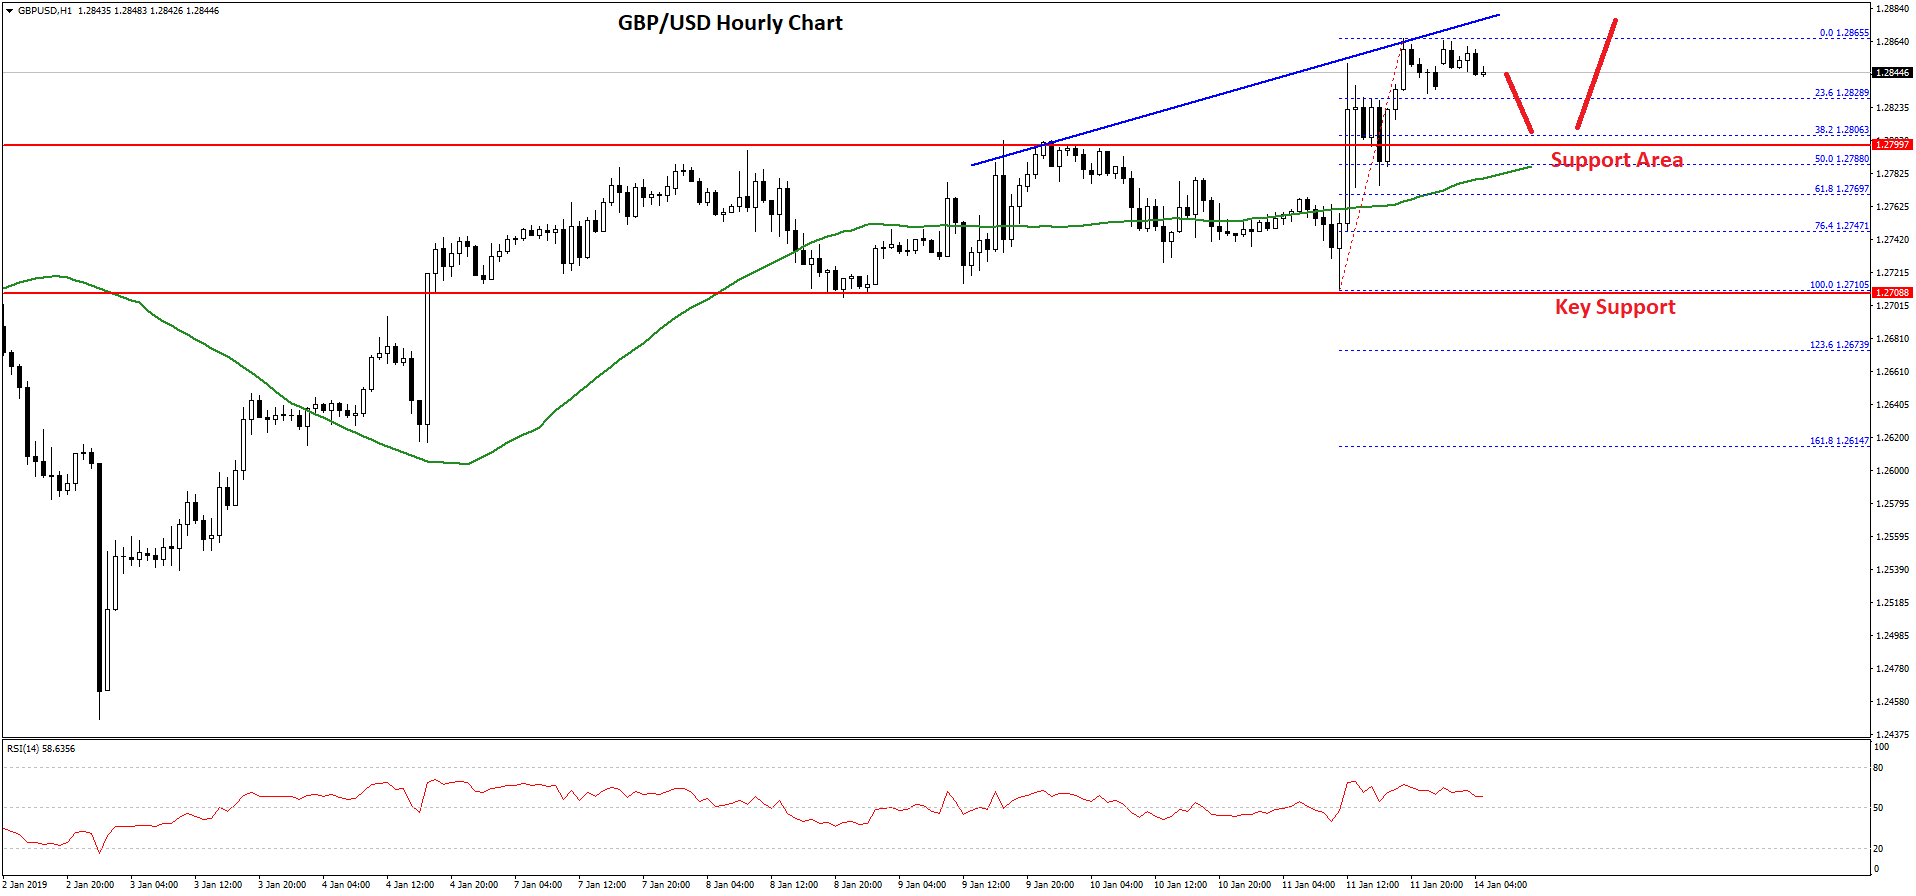
On the downside, there are many supports near the 1.2800, 1.2785 and 1.2750 levels. The main support is near the 50 hourly simple moving average and the 50% Fib retracement level of the last wave from the 1.2710 low to 1.2865 high near 1.2785.
If there is a break below the 50 hourly SMA, the price may decline towards the 1.2750 and 1.2720 support levels. On the upside, an initial resistance is near the recent high at 1.2865.
Moreover, there is a connecting resistance trend line in place at 1.2875 on the hourly chart of GBP/USD. A break above the trend line and 1.2880 could push the pair above the 1.2900 resistance in the coming sessions.
Overall, GBP/USD remains well supported on dips if there is a downside correction towards 1.2800 or 1.2785.
EUR/GBP Technical Analysis
The Euro failed on more than two occasions to break the 0.9060 resistance against the British Pound. As a result, the EUR/GBP pair started a major decline and broke the 0.9030 and 0.9000 support levels.
During the decline, there was a break below a major bullish trend line with support at 0.9025 on the hourly chart. The pair declined heavily and settled below the 0.9000 support and the 50 hourly simple moving average.
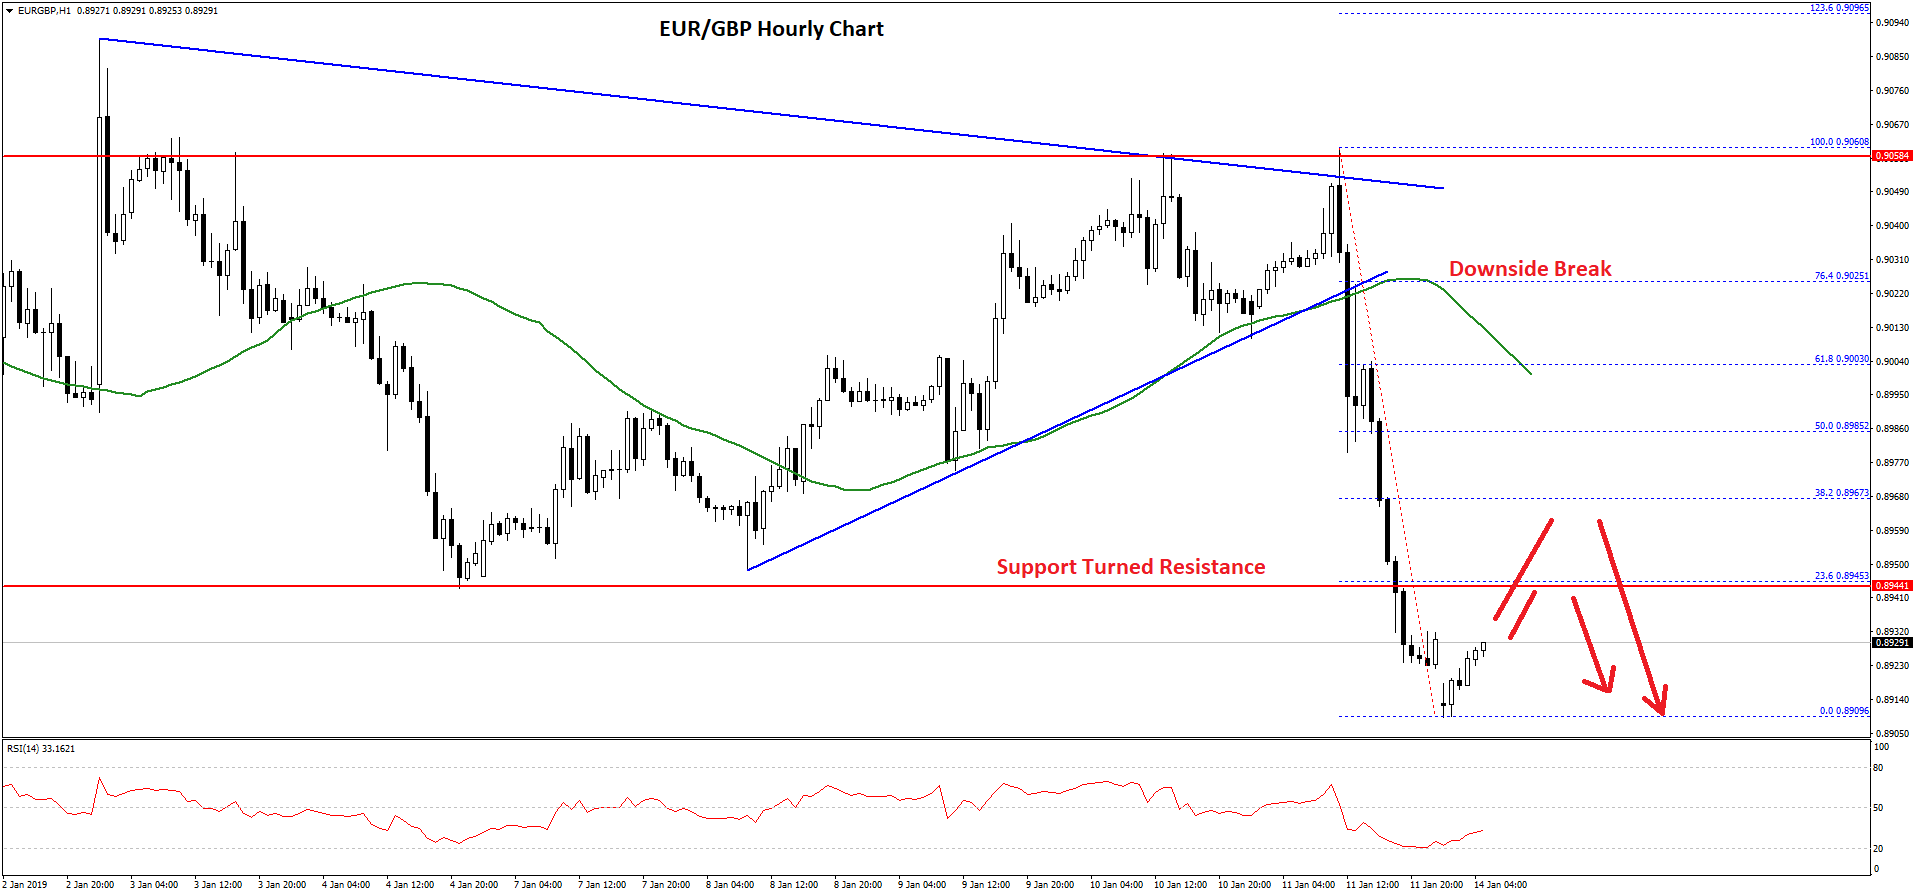
More importantly, the pair traded below the 0.8960 and 0.8945 support levels. A low was formed at 0.8909 and the pair is currently correcting higher. An initial resistance is near the previous support at 0.8945.
Besides, the 23.6% Fib retracement level of the recent decline from the 0.9060 high to 0.8909 low is also near the 0.8945 level to act as a solid resistance.
If there is a break above the 0.8945 and 0.8950 levels, the pair may recover towards the 0.8960 or 0.8985 resistance levels. The latter one is significant since it is the 50% Fib retracement level of the recent decline from the 0.9060 high to 0.8909 low.
Therefore, if the pair corrects higher towards 0.8945 or 0.8960, it is likely to face a strong selling interest in the near term.
Trade over 50 forex markets 24 hours a day with FXOpen. Take advantage of low commissions, deep liquidity, and spreads from 0.0 pips (additional fees may apply). Open your FXOpen account now or learn more about trading forex with FXOpen.
This article represents the opinion of the Companies operating under the FXOpen brand only. It is not to be construed as an offer, solicitation, or recommendation with respect to products and services provided by the Companies operating under the FXOpen brand, nor is it to be considered financial advice.
Stay ahead of the market!
Subscribe now to our mailing list and receive the latest market news and insights delivered directly to your inbox.


Latest articles

Weekly Market Insights with Gary Thomson: The Week of Central Banks and Earnings
In this video, we’ll explore the key economic events and market trends, shaping the financial landscape. Get ready for insights into financial markets to help you navigate the week ahead. Let’s dive in!
In this episode of Market

Intel at a Crossroads: Earnings Beat Meets Technical Resistance
Intel has just delivered its strongest quarter in over fifteen years, and the market reaction says it all. Q2 2026 revenue surged 25% year-over-year to $16.1 billion, crushing the consensus estimate of $14.42 billion, while adjusted EPS of

Tesla: Complex Range Structure Breaks Down Following Quarterly Earnings
Tesla released its Q2 2026 results after the market closed on 22 July. Revenue increased 26% year-on-year to $28.24 billion, while vehicle deliveries reached a record 480,126 units. However, operating margin fell sharply to 1.4%, down from